








Why Is the Market Moving? A Beginner's Guide to Connecting News, Sectors and NeoTrader
Why Did the Market Fall Today?
If you are new to the stock market, you've probably experienced this.
A company announces good results. You expect the stock to rise. Instead, it falls. Or: Nifty is green. You buy a stock. Your stock falls.
Then another day crude oil goes up, the rupee moves, the RBI announces something, FIIs sell, and suddenly everybody is explaining the market using completely different terms.
It can become confusing very quickly. The good news is that you don't need to understand everything at once. You only need to understand that markets are connected.
A useful way to simplify this is to recognize that markets are connected. Interest rates, currencies, commodities, sectors and company-specific factors can all influence price behavior.
Let's simplify the whole thing.
Think of the Stock Market as a Chain
A beginner often sees only the last link: The stock.
But before the stock, there is a sector. Before the sector, there is an industry. And before that, there is the broader economy.
A common framework for understanding this is:
Economy → Industry → Company
or EIC analysis. You don't need an economics degree to use this idea. You simply need to start looking at the market in the correct order.
Example 1: Why Does the Rupee Matter to Stocks?
Suppose an Indian company earns a large amount of revenue from customers in the United States. Those customers pay in dollars. Now imagine the rupee weakens.
When those dollars are converted back into rupees, the company may receive more rupees for the same dollar revenue. Now consider another company that imports expensive raw materials and pays in dollars. A weaker rupee could increase its cost.
Same currency move. Two different effects. This is why currency changes can affect exporters and importers differently. You don't need to become a currency trader. You simply need to understand that stock prices can react to factors outside the stock chart itself.
Example 2: Why Does the US Federal Reserve Matter in India?
You might have wondered: “Why does everyone in India care about what the US Federal Reserve says?”
One reason is global capital. Large institutional investors allocate money across many countries. Changes in global interest rates can affect where that money finds opportunities attractive. Changes in interest rates can influence foreign portfolio flows between developed and emerging markets.
That means a central-bank announcement thousands of kilometers away can still influence sentiment, currencies and capital flows into Indian assets. Again, you don't have to predict the Fed. You simply need to know why markets care.
Example 3: Why Does Crude Oil or Copper Affect a Stock?
Many companies use commodities as raw materials. If the cost of a key raw material rises sharply, the company has two choices. Either absorb the higher cost. Or increase prices for customers.
Both can affect the business. Changes in commodity prices can influence margins and demand across industries in very different ways.
This creates a simple learning rule: Never look at a company without understanding what makes or breaks its business.
How Do You Turn All This Information Into a Trading Decision?
This is where beginners often get stuck. You may understand that: Nifty matters, sectors matter, interest rates matter, results matter, crude oil matters.
But opening 100 websites every morning is not practical. This is where NeoTrader can help simplify the technical side of the process.
Start With the NeoTrader Dashboard
When you open NeoTrader, one of the first things you can study is the broader market environment.
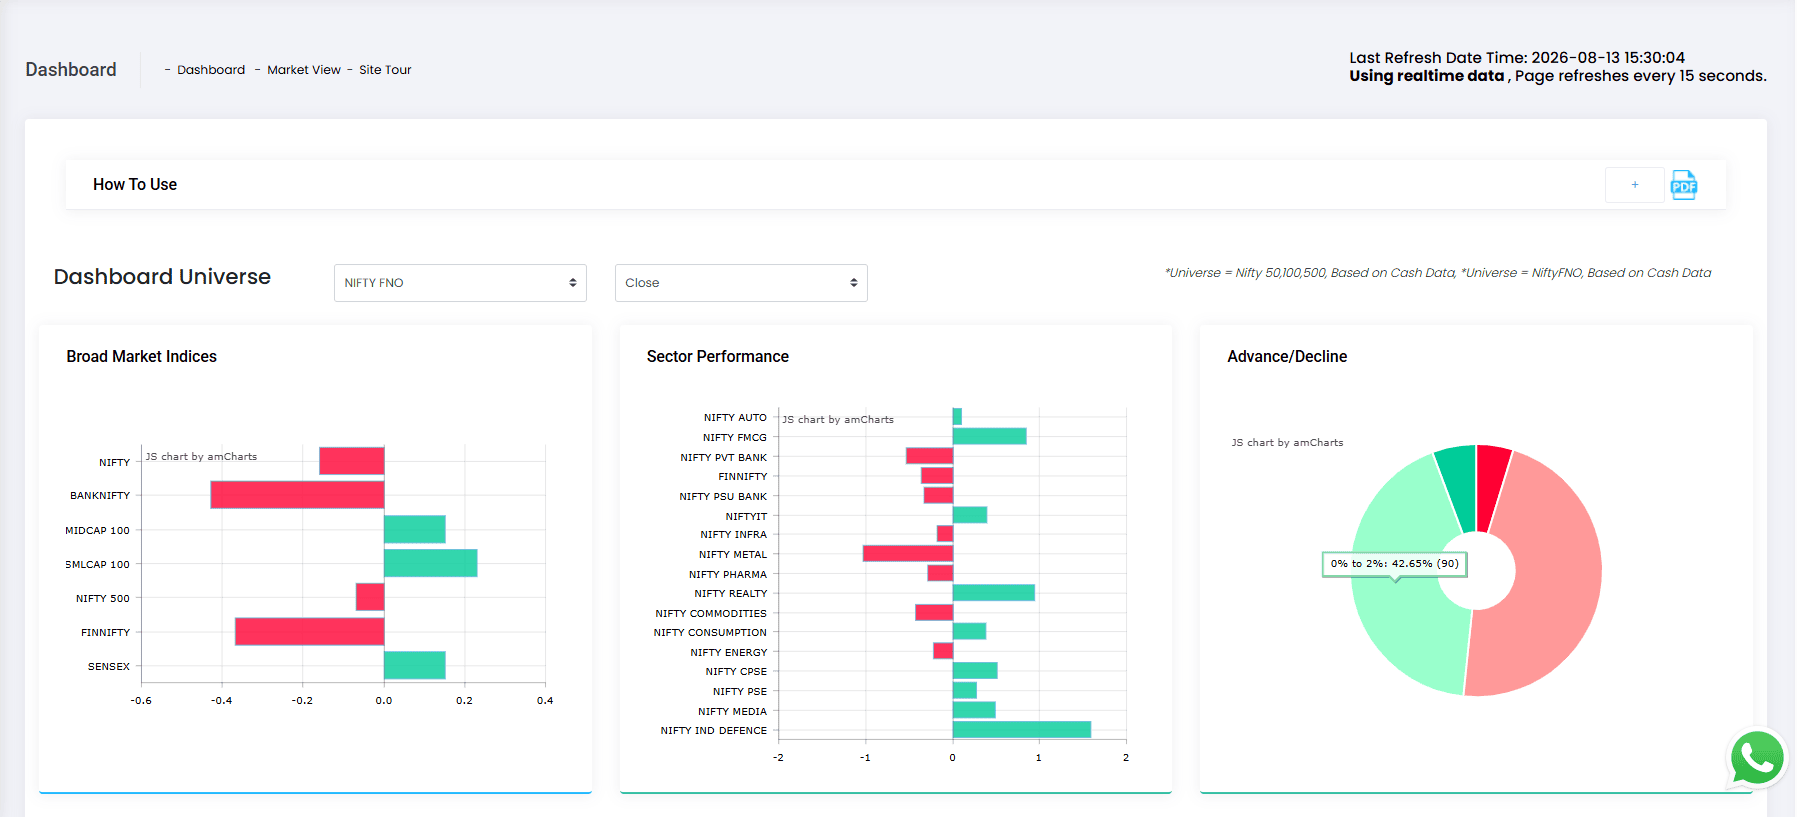
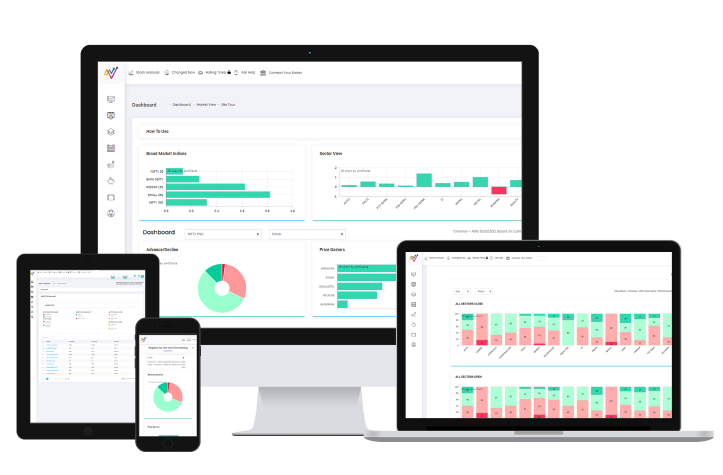
The Dashboard brings together: major market indices, sector performance, advance-decline information, bullish and bearish participation, and a detailed heat map.
NeoTrader's Dashboard is designed to support this top-down starting point before you move toward individual stock selection.
So your first question doesn't need to be: “What should I buy?” Start with:
“What is the market telling me today?”
Nifty Is Green. Is the Whole Market Strong?
Not always. This is one of the most important lessons for a beginner. An index can rise while many individual stocks remain weak. That's why market breadth matters.
NeoTrader's advance-decline view helps users see how much of the broader market is participating rather than judging conditions only from one headline index.
Think about it this way: Nifty tells you the score. Market breadth helps tell you how many players are contributing.
Next: Find the Stronger Sector
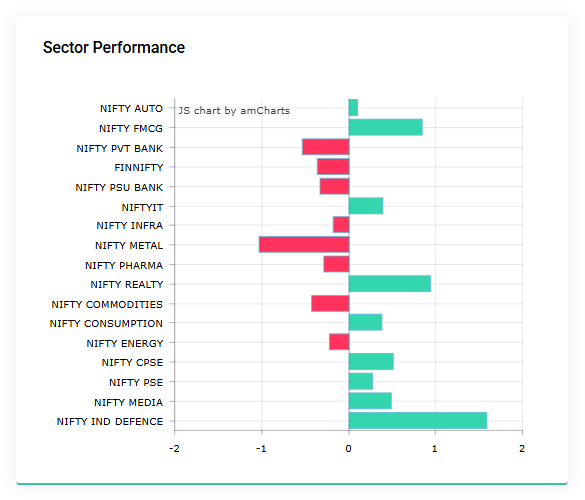
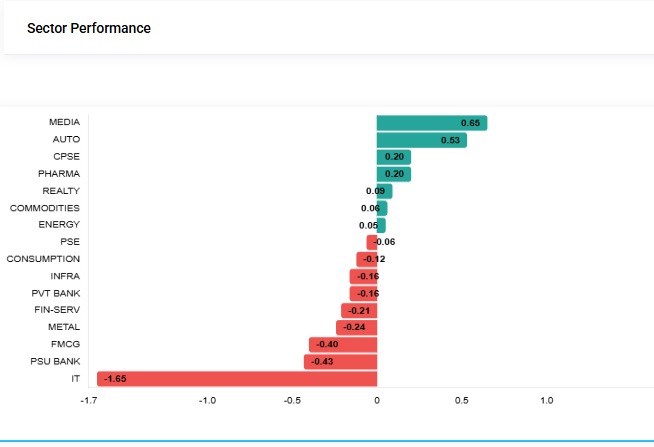
After understanding the overall market, look at sectors. Banking, IT, Pharma, Auto, Infrastructure, FMCG. They don't all move together every day.
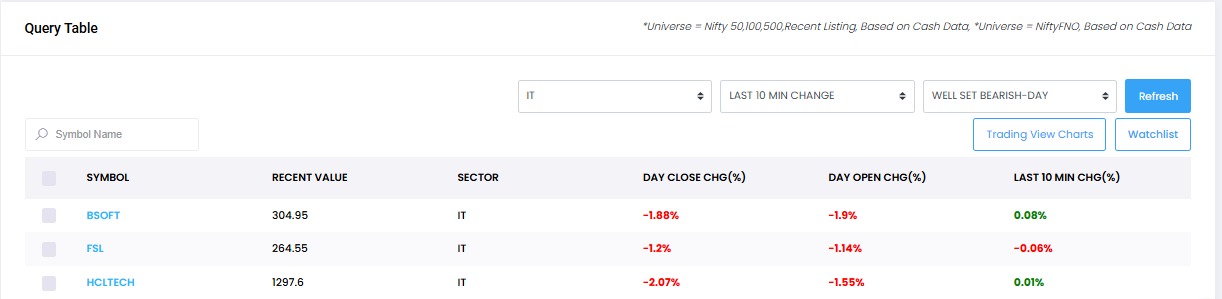
Through NeoTrader, users can analyse sector performance and can also filter stocks by a particular sector through the Query Window.
Now the stock-selection process becomes simpler: Market → Sector → Stock
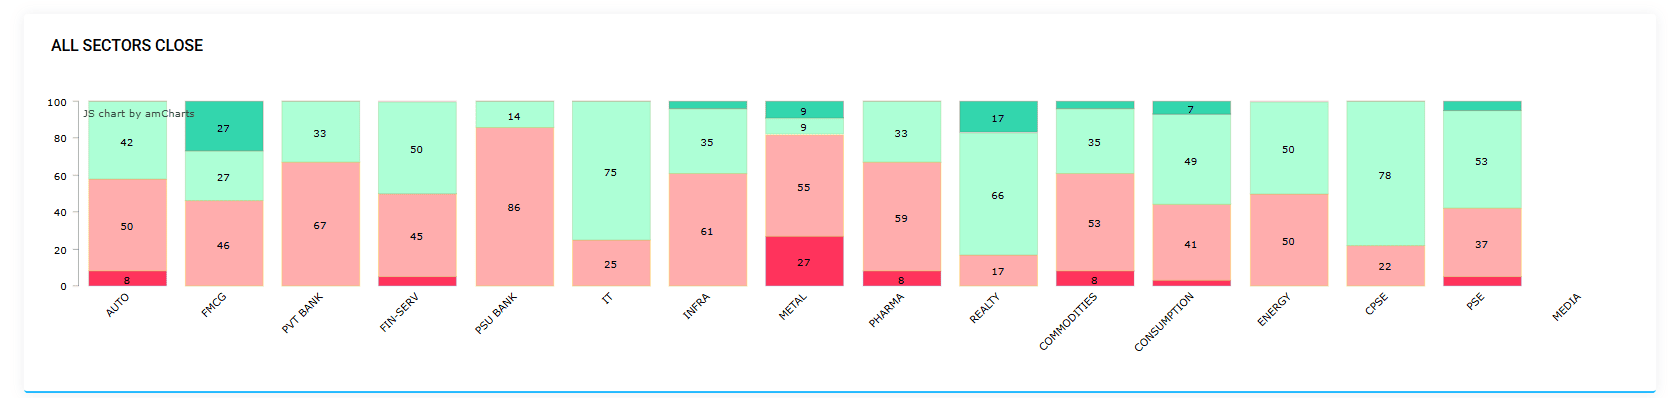
instead of: Random stock → Chart → Confusion
Then Understand the Stock's Trend
Once you have narrowed the universe, NeoTrader provides another layer through Active Stocks. You may see classifications such as:
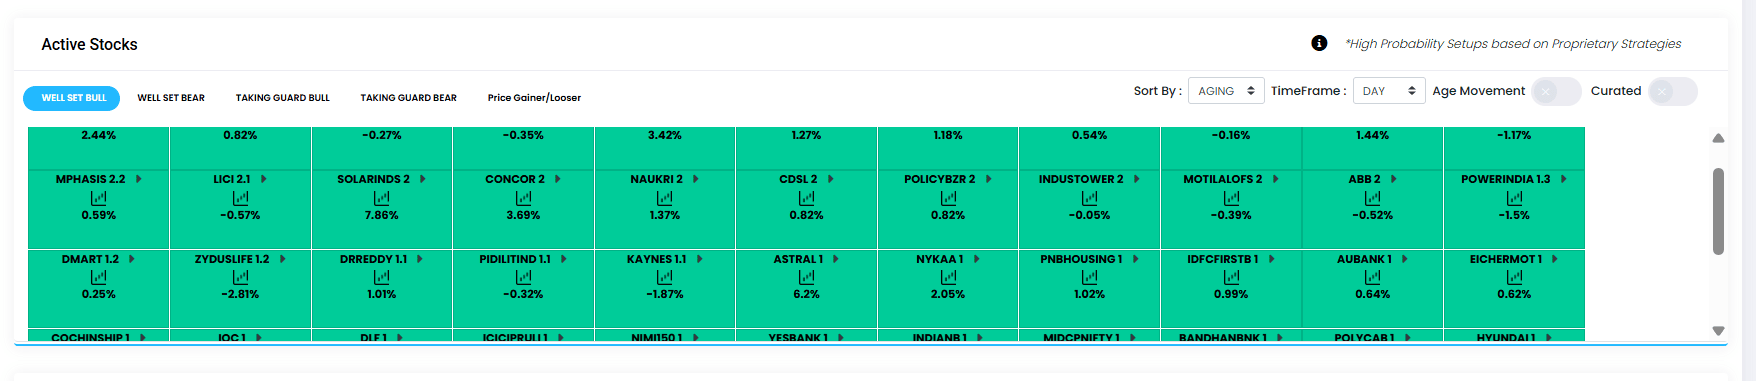
• Well-Set Bull
• Well-Set Bear
• Taking Guard Bull
• Taking Guard Bear
The distinction is useful for learners. Taking Guard refers to stocks where momentum is beginning to develop. Well-Set refers to stocks where directional momentum is more established. This teaches you to ask: Is the trend just beginning? or: Is it already established?
That is much more useful than simply seeing a green candle and assuming the stock is bullish.
Learning Does Not Mean Memorising Every Indicator
This is another mistake beginners make. RSI, ADX, Ichimoku, CPR, Candlesticks, Moving averages. Suddenly there are ten indicators on the screen. But the objective should not be to collect indicators. It should be to understand what question each tool is answering.
NeoTrader uses technology to scan multiple technical conditions and timeframes, reducing the need to manually review every stock and every chart individually. The platform can narrow a large market universe into filtered results that deserve closer attention. For an Eager Learner, this creates an interesting advantage: You can spend less time searching and more time understanding why a setup appeared.
What About Quarterly Results?
Results season can also become confusing. People hear: “Revenue up.” “Profit up.” “EPS up.” and conclude that a stock must rise.
But quarterly results should never be read without context. Seasonality can affect sectors differently. One-time items can influence reported profits. And looking at several companies within the same sector can provide more information about the broader trend than looking at one company alone.
So instead of asking: “Were the results good?” learn to ask: “Were they good compared with expectations, history and the rest of the sector?” Then observe what the price is actually doing.
What Should a Beginner's Daily Routine Look Like?
You don't need a complicated process. Try this:
Step 1 — Check the market
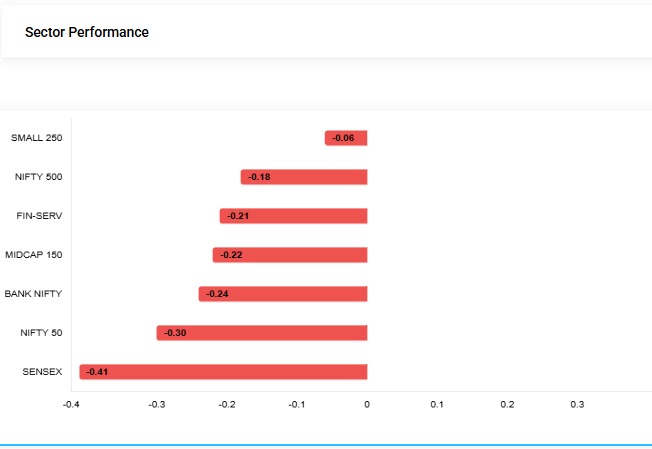
What are the broad indices doing?
Step 2 — Check market breadth
Is the move broad or concentrated?
Step 3 — Check sectors
Where is strength or weakness visible?
Step 4 — Shortlist stocks
Use NeoTrader's relevant screens instead of randomly searching.
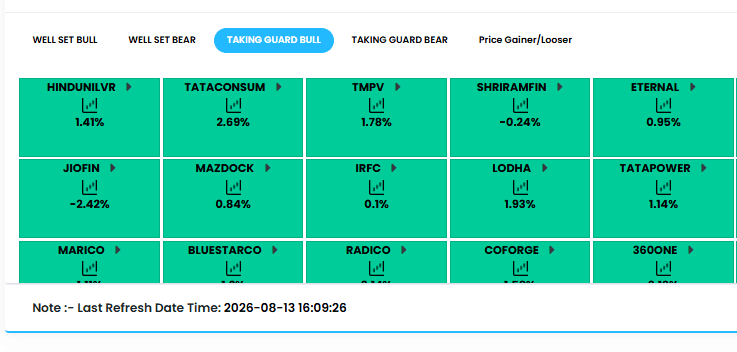
Step 5 — Understand the setup
Is the trend beginning or already established?
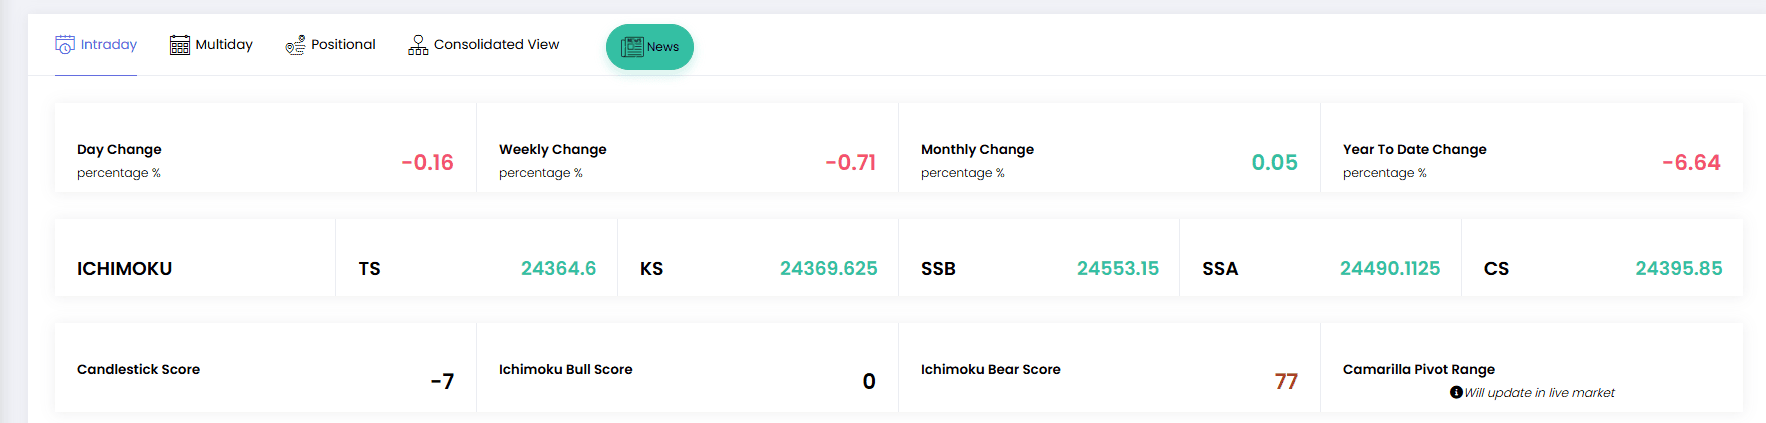
Step 6 — Check risk
Understand entry, stop-loss and trade horizon before acting.
Step 7 — Learn from the outcome
Don't judge your process only by whether one trade made or lost money. The goal is to develop a repeatable framework.
NeoTrader Should Help You Learn the Process, Not Skip It
Technology is most useful when it simplifies complexity. NeoTrader can help reduce: hundreds of stocks, multiple sectors, different technical signals, and several timeframes into a more manageable workflow.
But the final decision remains yours. NeoTrader is a technical-analysis platform designed to help users filter and analyse opportunities rather than simply depend on someone else to tell them what to buy. For a learner, that is important. Because the objective should not be: “How do I get more tips?” It should be:
“How do I gradually understand enough to make better-informed decisions myself?”
Conclusion
The stock market becomes much easier to understand when you stop treating every movement as a separate mystery.
Interest rates connect to capital flows. Currency movements connect to companies. Commodity prices connect to costs. Government policies connect to sectors. Sectors connect to stocks. And finally, technical analysis tells you what price itself is doing. The learning journey can therefore follow:
Economy → Market → Sector → Stock → Technical Setup → Risk
You do not need to master every stage on Day 1. Start by learning the order. NeoTrader can then help you bring the market, sector and technical layers together in one place—so instead of randomly looking for trades, you gradually build a process for understanding why a stock deserves your attention.
If you're new to the market and want to see this process practically, book a NeoTrader demo and experience the Market → Sector → Stock workflow live.
(For educational and informational purposes only. Trading and investing involve market risk. The examples in this article are intended to explain market concepts and should not be considered investment recommendations.)
Like what you see? Share with a friend.


