









Technical Analysis for Intraday Trading: Why Confirmation Matters More Than the First Signal
One Indicator Is Information. Confirmation Is a Process.
Many experienced traders understand several technical indicators:
• RSI
• Moving averages
• Ichimoku
• Fibonacci
• Support and resistance
• Pivot levels
The problem is usually not a lack of indicators.
The problem is knowing which information matters before you actually take a trade.
A strong technical process should follow a simple sequence:
Identification → Confirmation → Execution
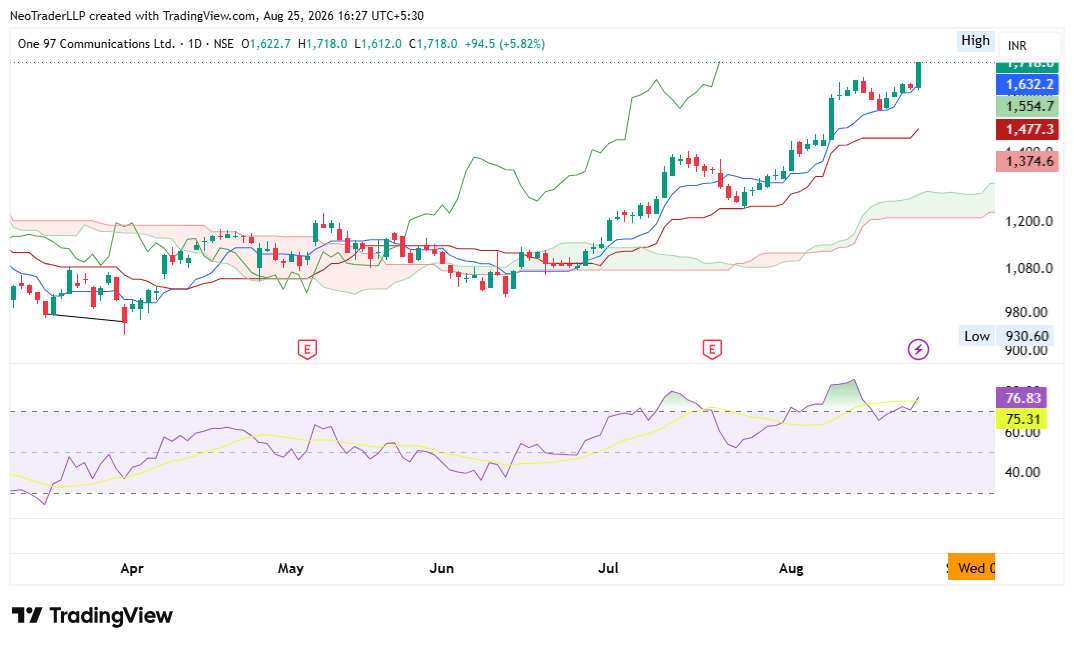
That distinction is important. Finding a bearish stock is not the same as finding a good short trade. Finding an oversold RSI is not automatically a buy signal. Seeing price approach support does not guarantee that the support will hold. For a serious trader, technical analysis should work as a decision-making framework rather than a collection of isolated signals.
Start With the Higher Timeframe
Imagine you identify a bearish signal on a 30-minute chart.
The temptation is to enter immediately.
But what happens if the stock is sitting directly on an important support level visible on the daily chart?
Your short-term signal may be correct, but your entry location may be poor.
This is why a disciplined trader should move between intraday charts and the daily chart before considering a trade.
A practical workflow is:
Daily Chart → Broader Trend
30/60-Minute Chart → Setup
Lower Timeframe → Execution
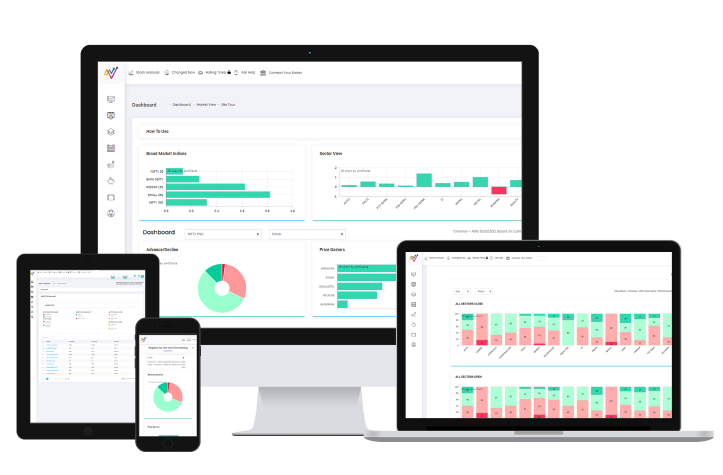
NeoTrader’s product workflow supports multiple-timeframe analysis. Users can study different timeframes through Market View, technical pages and Stock Analyzer rather than treating every signal as an isolated intraday event.
RSI Is More Useful When You Stop Treating 30 and 70 as Magic Numbers
One of the most common beginner interpretations of RSI is:

RSI Above 70 = Sell
RSI Below 30 = Buy
Markets are rarely that simple.
RSI can also be useful around intermediate zones such as 50 and 60, especially when assessing whether momentum is maintaining a bullish or bearish structure.
For example, if price is declining but RSI has reached an important momentum-support area, aggressively entering a fresh short may require more thought.
Similarly, a stock can remain technically strong even when its RSI appears elevated.
The question should therefore change from:
“Is RSI overbought?”
To:
“What is RSI telling me about the current momentum structure?”
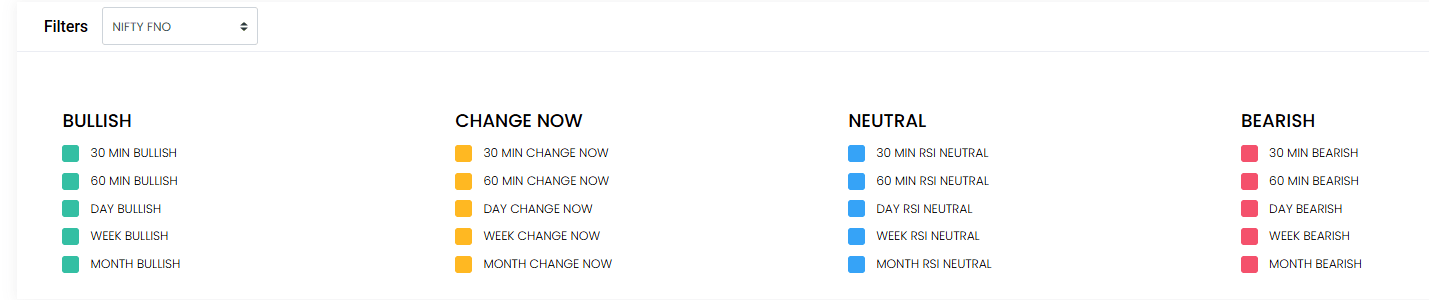
NeoTrader’s RSI Trends page allows users to screen a larger universe and compare bullish or bearish RSI conditions across different timeframes.
That is much more efficient than opening hundreds of charts manually.
Add Ichimoku for Trend Context
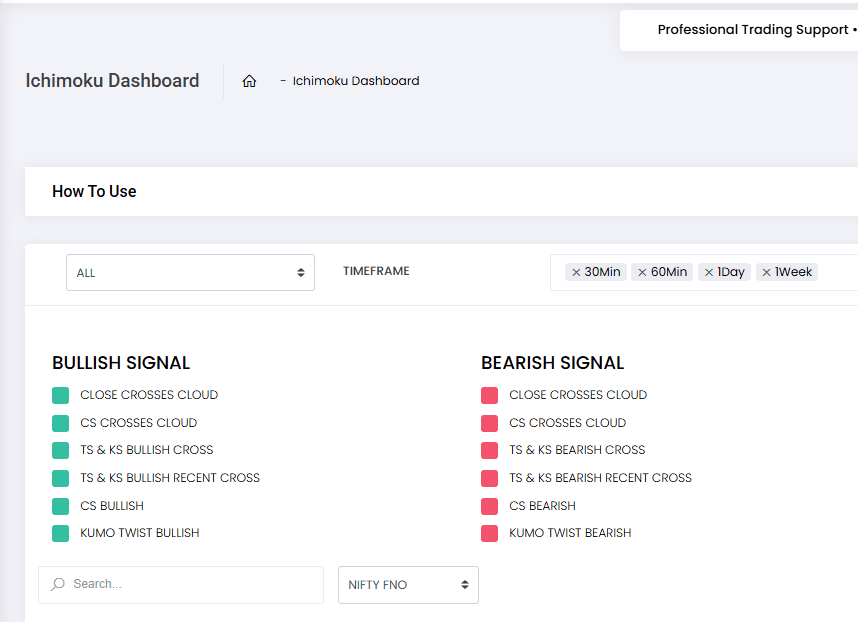
Ichimoku can add another layer of trend context.
The purpose is not simply to memorise every Ichimoku line.
The practical question is:
Is price structurally bullish, bearish or unclear?
For example, if a potential short candidate is already trading below an important Ichimoku structure on the higher timeframe, the bearish intraday setup gains additional context.
If price is moving into or repeatedly crossing the cloud, the structure may be less clear.
NeoTrader’s Stock Analyzer combines several technical views, including Ichimoku-related data, allowing users to study a stock beyond one isolated signal.
Fibonacci Helps Answer a Different Question
RSI helps evaluate momentum.
Ichimoku helps traders understand trend structure.
Fibonacci levels can help identify potential retracement, support and resistance areas.
These tools should not be competing with one another.
They answer different questions.
Suppose the Nifty 50 has experienced a strong directional move and is now pulling back.
Instead of assuming that every decline means the trend has reversed, Fibonacci retracement can help identify zones where traders may watch for a reaction.
Fibonacci retracement can be combined with moving averages, RSI and price levels to judge whether an index or stock is approaching an important decision zone.
The lesson is not:
“The 38.2% level will definitely hold.”
It is:
“Several forms of evidence are pointing towards an important decision zone.”
That is confirmation-based analysis.
NeoTrader: Moving From Screening to Confirmation
This is where NeoTrader can help reduce one of the biggest problems serious traders face:
Too much information.
The platform’s Expert Alerts can display stocks qualifying across different technical modules.
The Summary tab provides a count showing which stocks appear across multiple studies.
These stocks can then be moved into a Dynamic Watchlist and monitored through Rolling Ticker for additional signals.
That creates a structured workflow.
1. Identify
Use technical filters to narrow the market.
2. Shortlist
Find stocks where relevant technical conditions are already present.
3. Confirm
Check the trend, RSI, support and resistance, Ichimoku structure and broader market context.
4. Monitor
Use Dynamic Watchlist and Rolling Ticker to monitor shortlisted opportunities.
5. Execute
Take the trade only when the setup fits your predefined trading plan.
The objective is not to create a chart containing ten indicators.
The objective is to gradually remove uncertainty.
What If Different Indicators Disagree?
That disagreement itself is useful information.
If RSI appears bullish while the price structure remains bearish and the broader market lacks clarity, there may not be a clean trade yet.
Contradictory long and short signals deserve caution.
Check the timestamp first. If genuinely conflicting signals are appearing together, the stock may be in a choppy phase where waiting for a clearer direction may be preferable.
A sophisticated trader understands that:
No confirmation can also be a conclusion.
Sometimes, the absence of a clear setup is enough reason to wait.
A Confirmation-Based Intraday Trading Framework
Before taking an intraday trade, ask:
1. What Is the Higher-Timeframe Trend?
Determine whether the broader structure is bullish, bearish or unclear.
2. Where Are the Important Price Levels?
Identify nearby support, resistance, pivot and Fibonacci levels.
3. Is Momentum Supporting the Setup?
Use RSI and other momentum tools to understand the current structure rather than relying only on overbought or oversold readings.
4. Is the Trend Structure Clear?
Use tools such as Ichimoku to determine whether the stock is structurally bullish, bearish or moving through an unclear phase.
5. Is the Broader Market Aligned?
Check whether the Nifty 50, relevant sector and overall market environment support the trade.
6. Are Multiple Conditions Confirming the Setup?
Avoid treating one technical signal as a complete trading decision.
7. Does the Trade Fit Your Plan?
Understand the entry, stop-loss, risk and trade objective before execution.
Conclusion
Technical analysis is not about finding the indicator that can predict every market move.
It is about asking better questions:
• What is the larger trend?
• Where are the important levels?
• Is momentum supporting the trade?
• Is the stock aligned with the broader market?
• Has the setup been confirmed?
• Where is my analysis wrong?
NeoTrader helps organise these questions into a more structured process through technical screening, multiple-timeframe analysis, Stock Analyzer, Dynamic Watchlists and Rolling Ticker.
The real goal is not more signals.
It is better context around the signals you already have.
Build a More Structured Intraday Trading Process
Want to see how NeoTrader combines screening, technical analysis and confirmation into one workflow?
Book a personalised NeoTrader product walkthrough.
(Disclaimer: For educational and informational purposes only. Trading and investing involve market risk. Technical indicators and confirmation methods do not guarantee trading outcomes. NeoTrader supports technical analysis and decision-making; it does not eliminate market risk.)
Like what you see? Share with a friend.


