








Support and Resistance for Beginners: How RSI, Ichimoku and Fibonacci Add Confirmation
What Exactly Is Support?
Suppose the Nifty 50 keeps falling towards the same price area. Each time it reaches that zone, selling slows and buying begins to appear.That area may become an important support zone.Resistance works in the opposite direction.
Price repeatedly moves higher, reaches a particular zone and struggles to continue.Support and resistance are among the most fundamental concepts in technical analysis.But there is one common mistake:
Beginners often treat support and resistance as exact lines where price must reverse.
They are better understood as decision zones.Support represents an area where buying interest may emerge.Resistance represents an area where selling pressure may appear. Neither guarantees that the price will reverse.
Why Repeated Testing Matters
Support and resistance are best understood through probability rather than certainty.
When support is repeatedly tested, traders should observe:
• Is buying still emerging?
• Is momentum weakening?
• Is price beginning to close below the level?
• Is the support zone becoming weaker?
Likewise, when resistance is repeatedly tested, traders should ask whether selling pressure is still strong enough to prevent price from moving higher.
The more useful question is not:
“Will this support definitely hold?”
It is:
“What is price doing as it reaches this support?”
That is technical analysis.
Add RSI to Understand Momentum
RSI is one of the most popular stock-market indicators.
But many beginners only know:
Below 30 = Oversold
Above 70 = Overbought
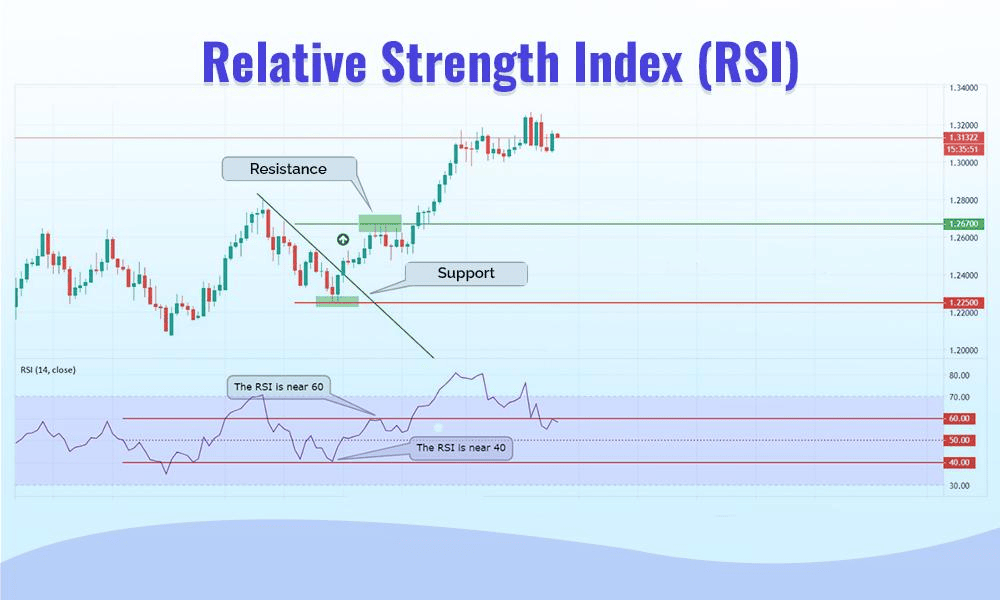
In reality, RSI can provide much more context.
During trending markets, levels such as 40, 50 and 60 can also become important reference areas for momentum.
For example, if price is approaching support and RSI is also approaching an important momentum zone, the combination may deserve closer attention.
It does not guarantee a reversal.
It simply creates an additional piece of evidence.
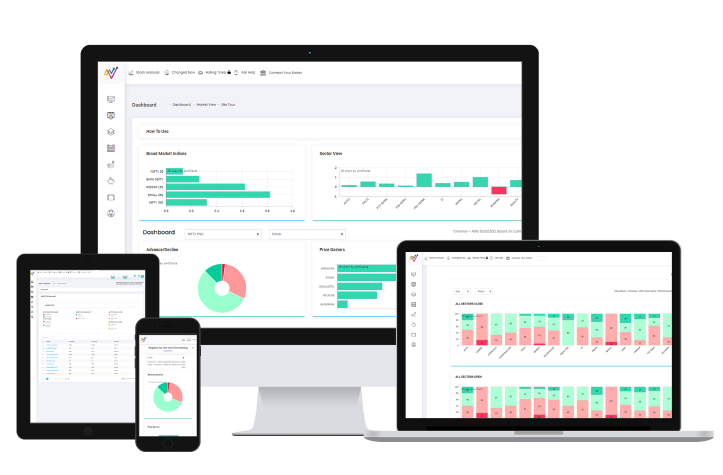
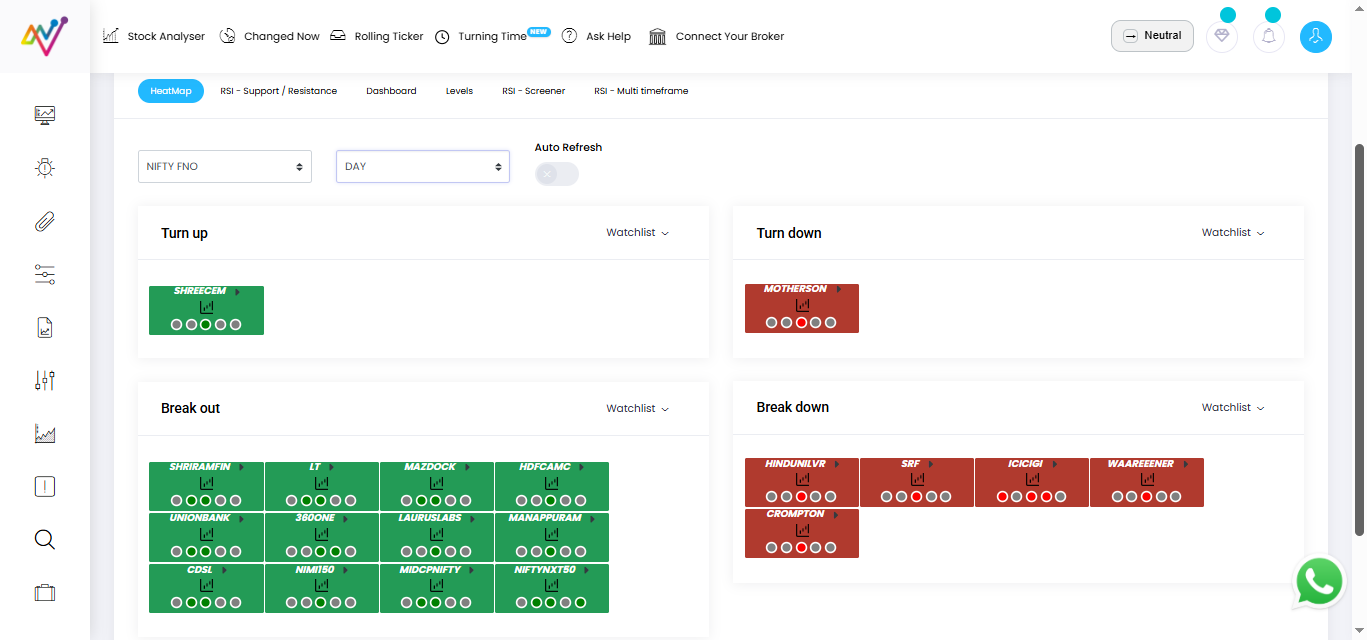
NeoTrader’s RSI Trends page allows users to view RSI conditions across a larger basket of stocks and different timeframes rather than checking every stock manually.
What Does Ichimoku Add?
Ichimoku may look complicated when you first see it.
• Multiple lines
• Clouds
• Crossovers
But beginners can start with a much simpler question:
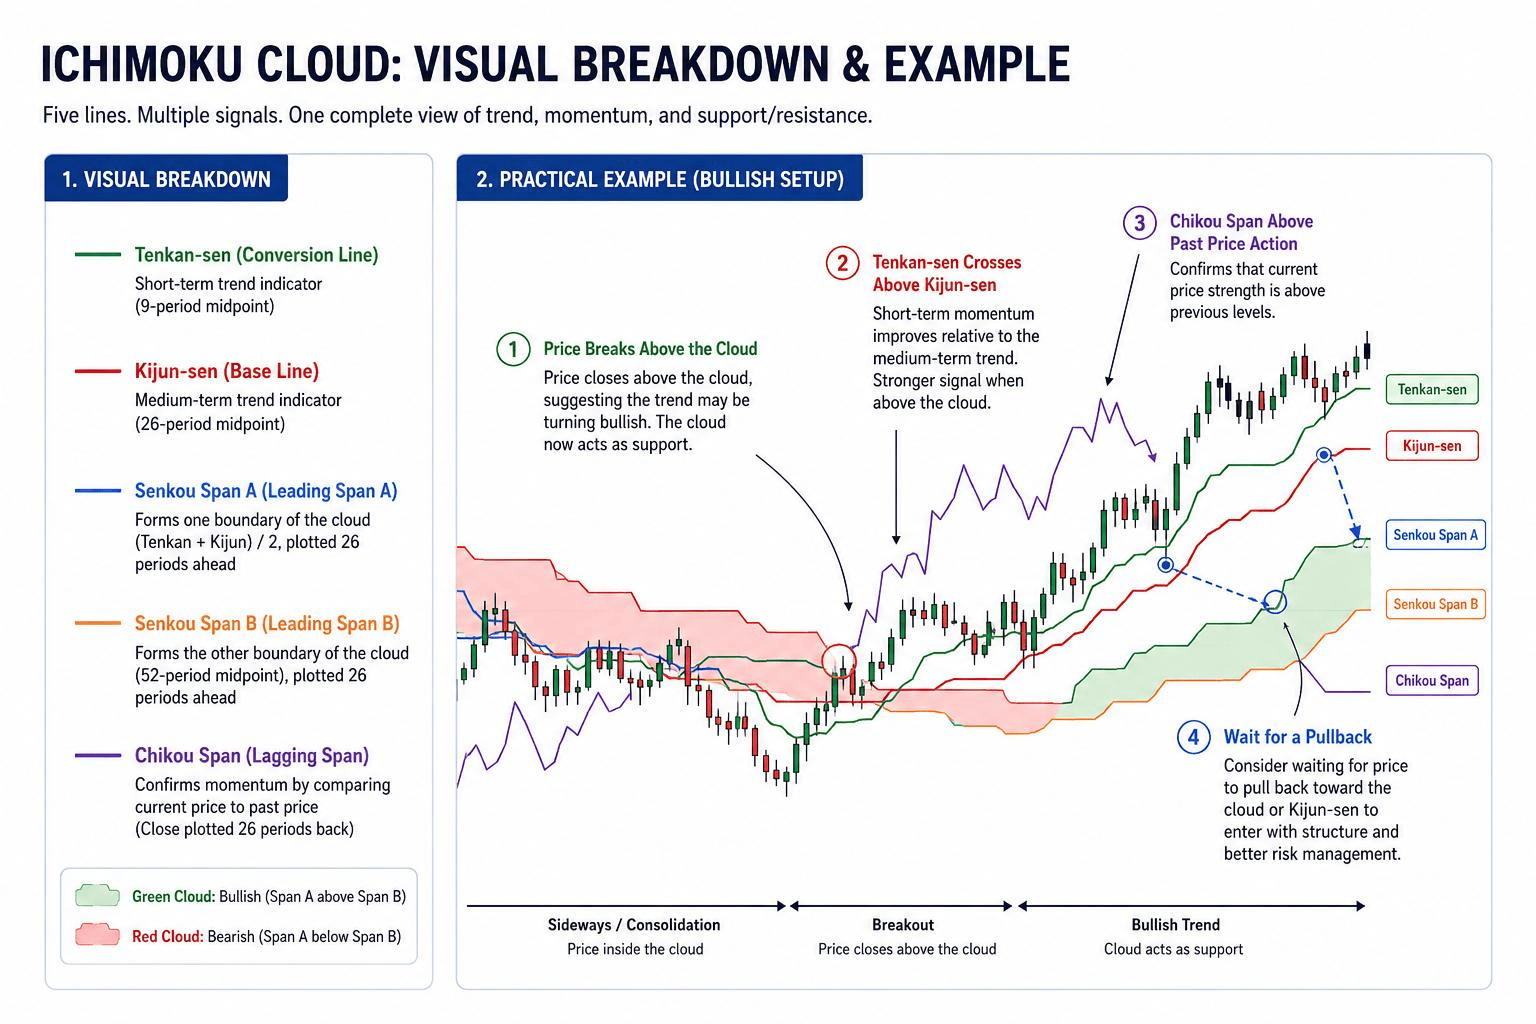
Is price structurally above, below or inside the broader trend zone?
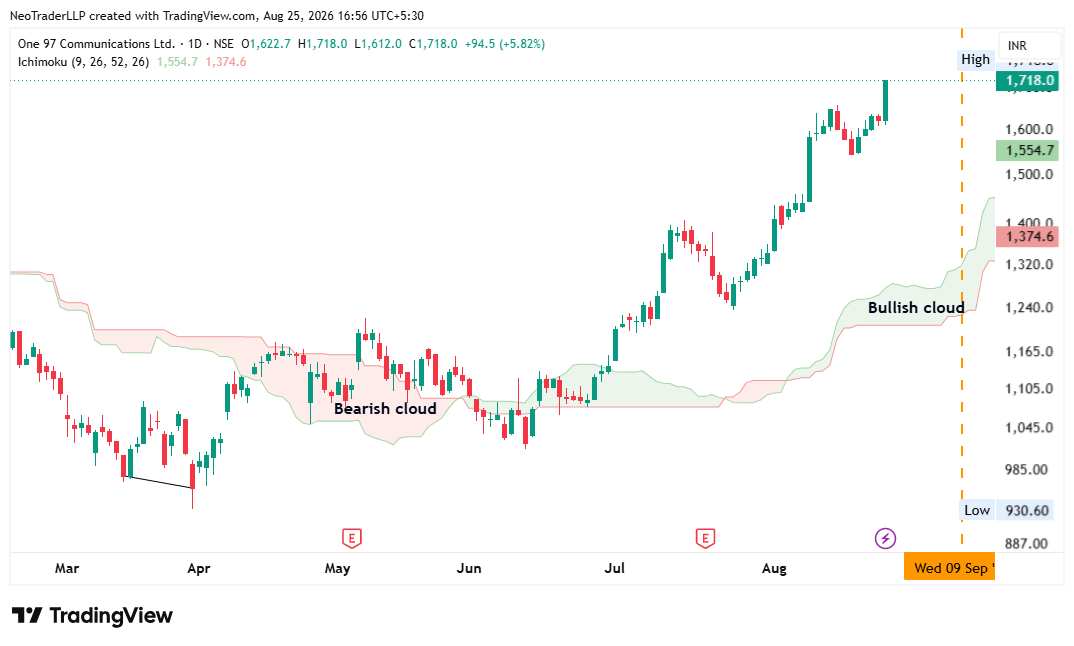
If price is clearly below the Ichimoku cloud, the market structure may remain under pressure.
If price is clearly above the cloud, the bullish structure may be stronger.
If price is repeatedly moving through the cloud, the direction may be unclear.
NeoTrader’s Stock Analyzer includes Ichimoku information alongside other technical inputs, providing a consolidated way to examine a stock.
Fibonacci Retracement: Where Could a Pullback React?
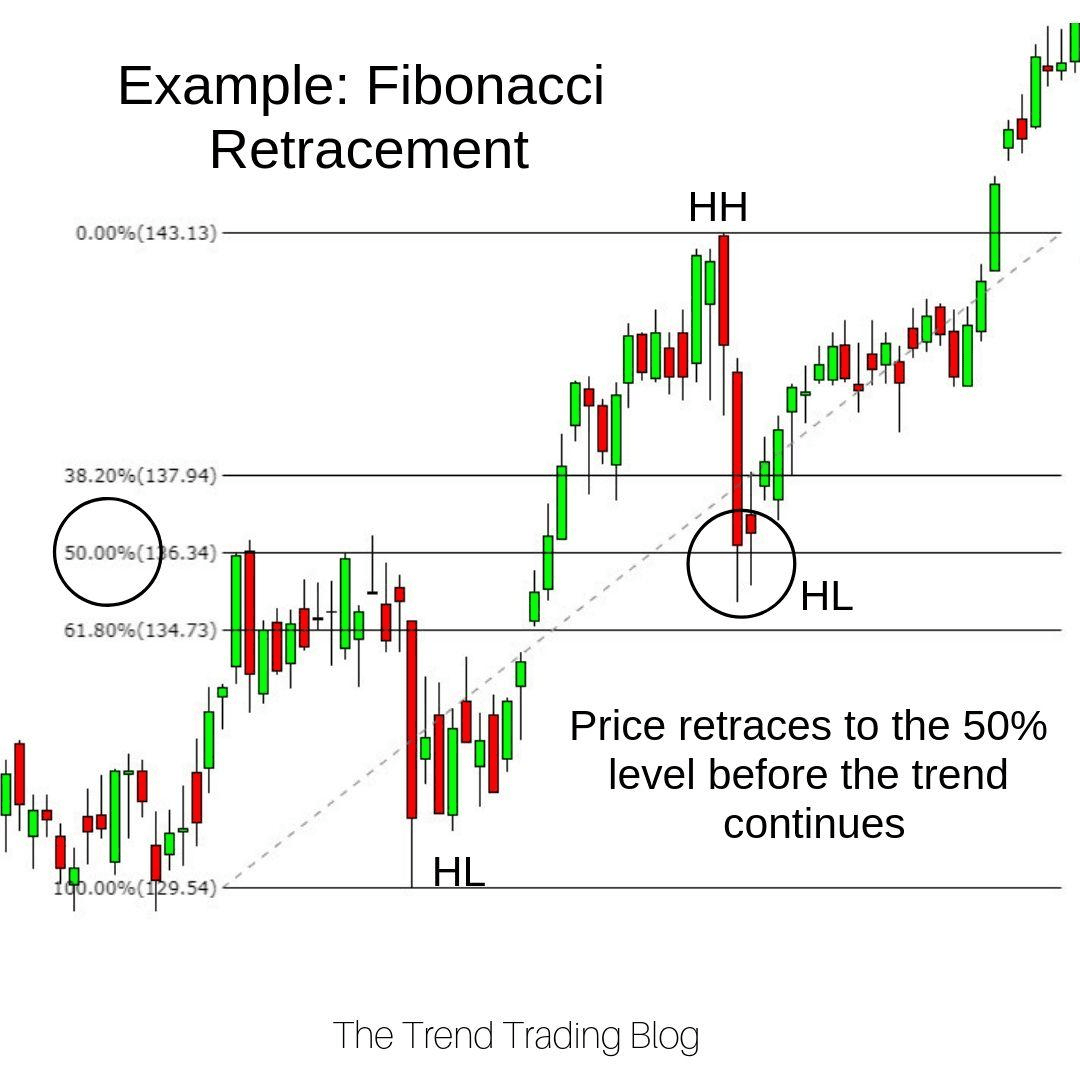
Fibonacci retracement can add another useful reference point.
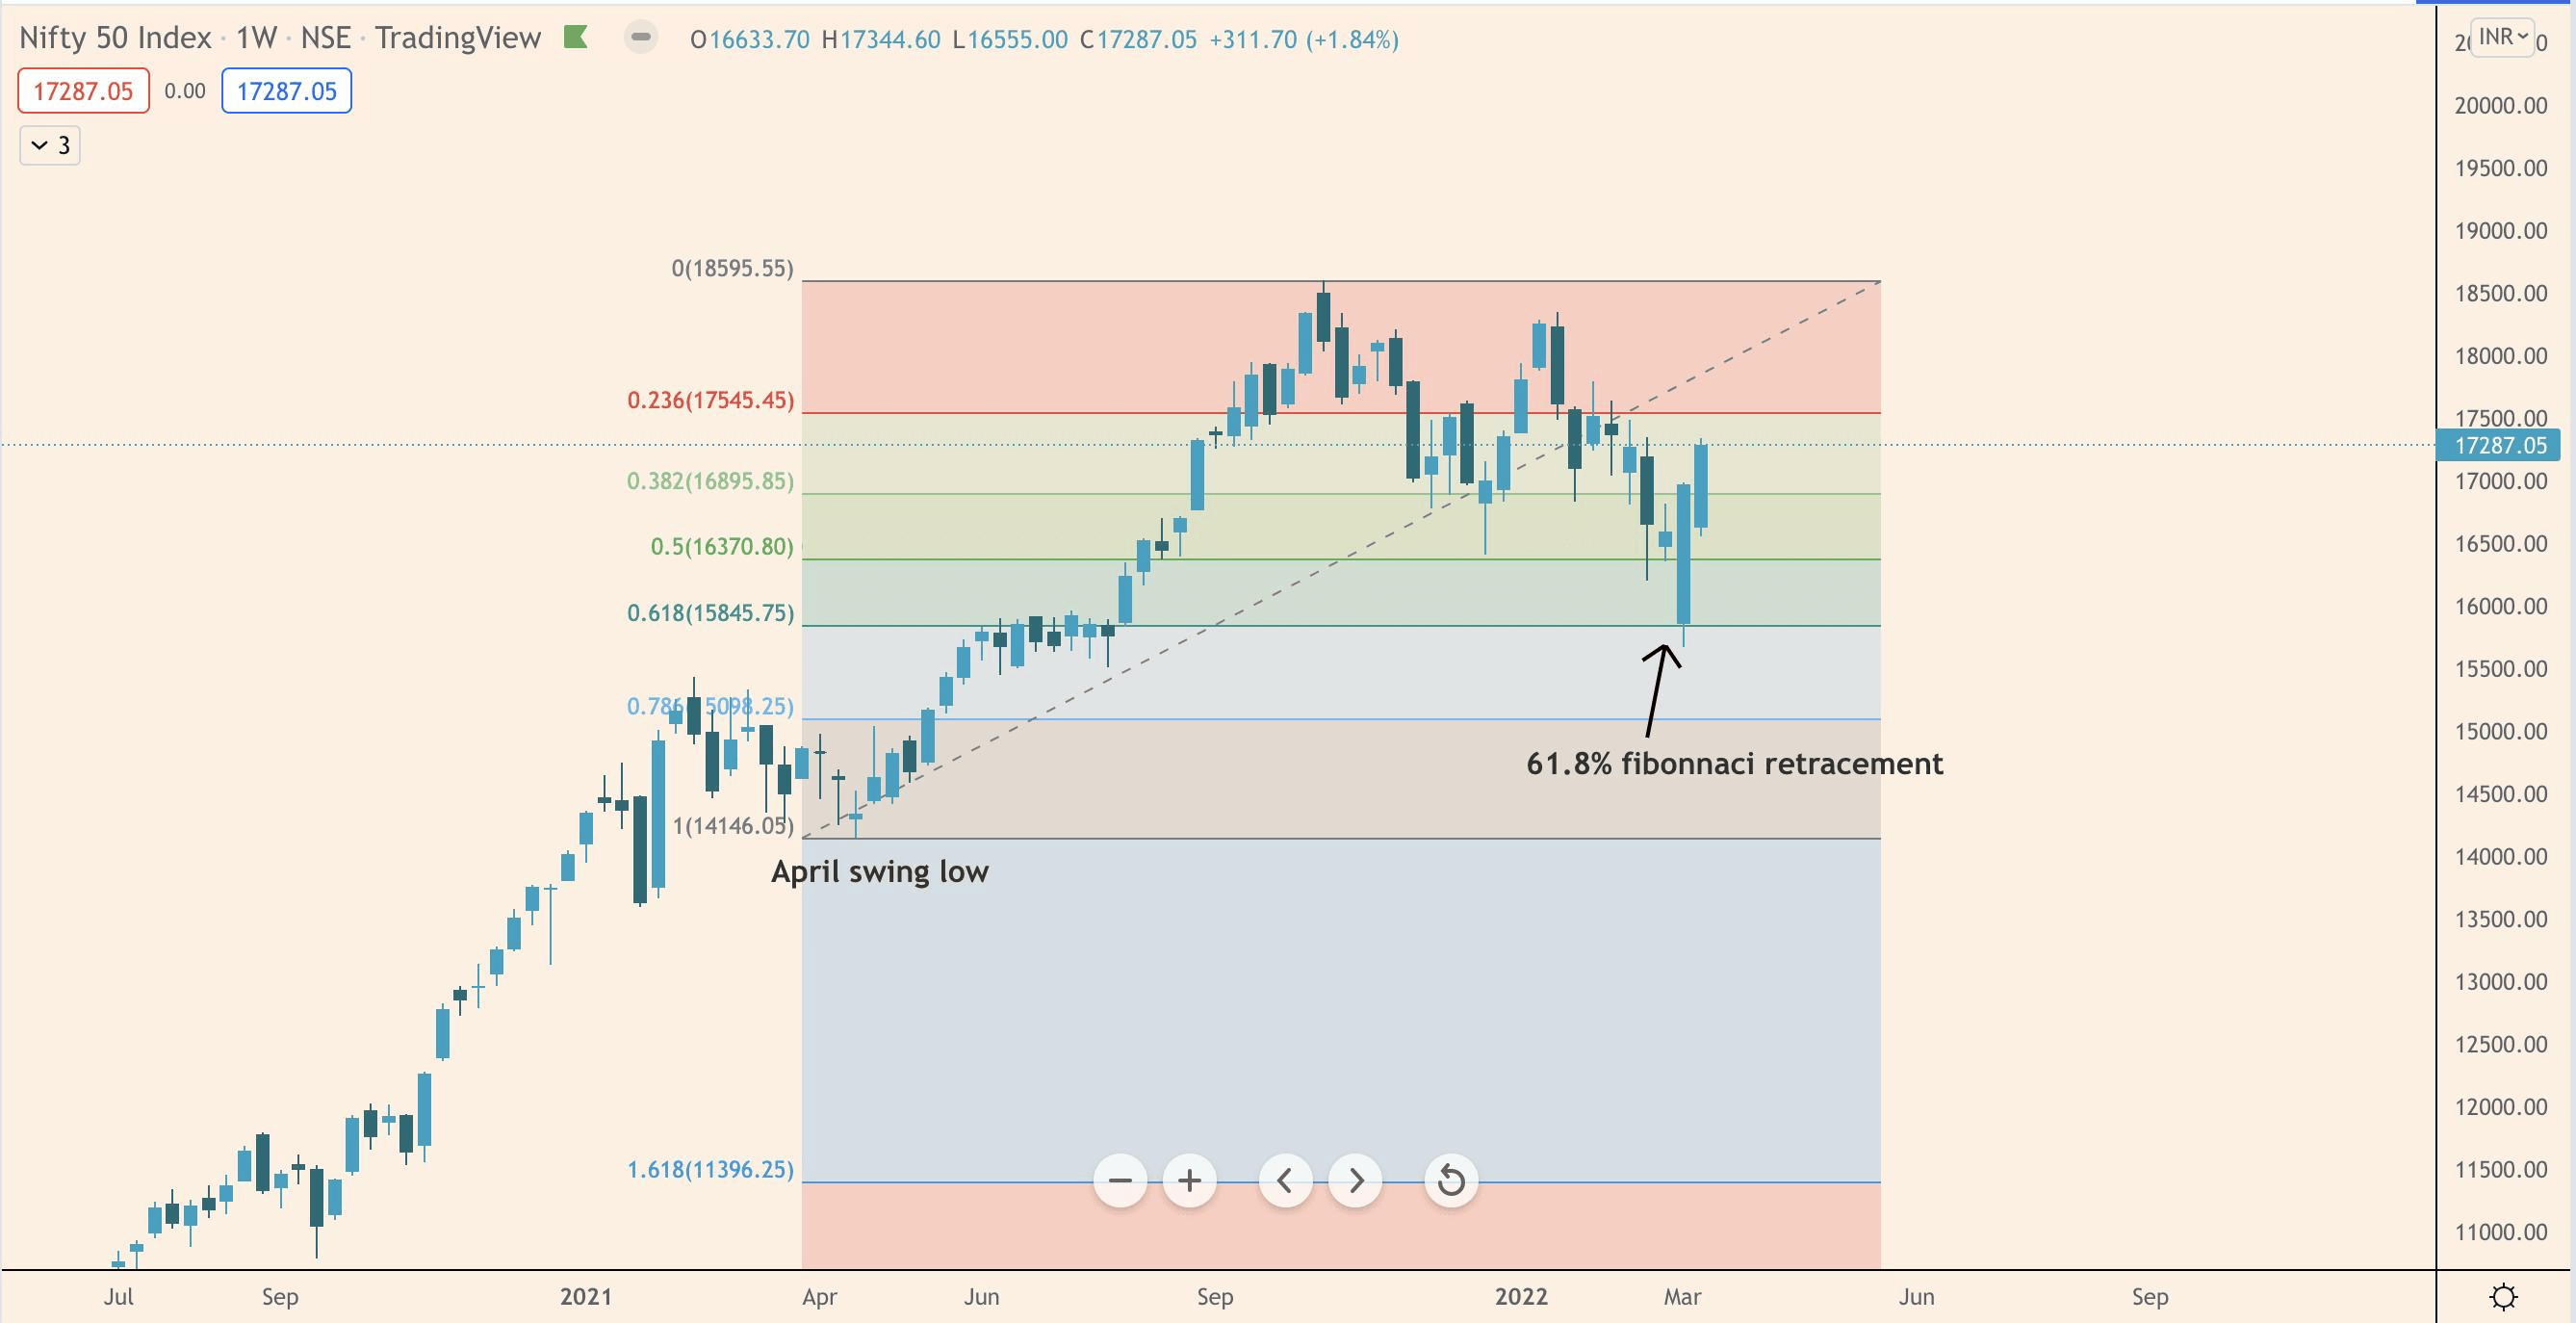
Suppose the Nifty 50 has moved strongly upwards and then begins to decline.
Instead of immediately assuming that the entire trend has turned bearish, a trader can measure the previous move and observe common Fibonacci retracement areas.
Once again:
A Fibonacci level is not a guarantee.
It provides a potential area to watch.
Now imagine several technical factors meeting around the same zone:
• Previous price support
• A moving average
• A Fibonacci retracement level
• RSI momentum support
That zone deserves more attention than a random point on the chart.
This is the principle of confirmation.
The greater value comes from understanding how different forms of technical evidence interact—not from expecting one tool to predict the market.
Why Different Timeframes Matter
Imagine that the five-minute chart looks extremely bearish.
But the daily chart shows the price sitting directly above a major support zone.
Both statements can be true.
The short-term trend can be bearish while the larger market is approaching a potential reaction zone.
That is why NeoTrader allows users to study different technical conditions across multiple timeframes.
The relevant timeframe can change depending on whether the opportunity is:
• Intraday
• Multi-Day
• Positional
Beginners should remember:
Lower Timeframe = More Detail
Higher Timeframe = More Context
You need both.
Studying only a lower timeframe can cause you to miss an important larger trend or price level.
Studying only a higher timeframe may not provide enough detail for timing an entry.
Support Is a Zone, Not a Promise
Suppose price reaches a support zone while RSI is approaching a momentum-support level.
That may appear encouraging, but confirmation is still required.
Traders can observe:
• Whether price begins rejecting the lower levels
• Whether buying activity starts appearing
• Whether momentum begins improving
• Whether price forms a reversal structure
• Whether the higher timeframe supports the idea
If price closes decisively below the support zone, the original analysis may no longer remain valid.
The purpose of support and resistance is not to tell you what must happen.
It is to help you recognise where an important market decision may occur.
A Simple Beginner Framework
Before your next trade, ask five questions.
1. What Is the Trend?
Is the market bullish, bearish or moving sideways?
Understanding the broader direction gives context to every other indicator.
2. Where Are the Important Levels?
Identify support, resistance, previous highs and lows, pivot levels and other relevant price zones.
3. What Is Momentum Saying?
Use RSI as supporting information rather than treating every overbought or oversold reading as an automatic trading signal.
4. What Does the Higher Timeframe Show?
Do not analyse a five-minute chart in isolation.
Check whether the higher timeframe supports or contradicts the short-term setup.
5. What Confirms the Trade?
Price behaviour should support your trading idea before execution.
A practical learning progression can be:
Market Basics → Technical Analysis → Price Action → Risk Management → Application
How the Tools Work Together
Each technical tool answers a different question.
| Technical Tool | Question It Helps Answer |
|---|---|
| Support and resistance | Where could price react? |
| RSI | What is the momentum structure? |
| Ichimoku | Is the broader structure bullish, bearish or unclear? |
| Fibonacci retracement | Where could a pullback find a reaction zone? |
| Multiple timeframes | What is the short-term detail and broader context? |
| Price behavior | Is the market confirming the trading idea? |
The objective is not to add every indicator to the same chart.
The objective is to use relevant tools to build context around a potential opportunity.
NeoTrader Can Reduce the Search Work
A learner can spend too much time searching through charts.
This is where a technical-analysis platform can help.
NeoTrader provides:
• Dashboard and heat maps
• Market and sector information
• RSI-based views
• Ichimoku-related analysis
• Expert Alerts
• Watchlists
• Rolling Ticker
• Stock Analyzer
• Ready-Made Trade sections
The platform can help reduce the number of stocks that need to be examined manually, while the educational process helps users understand why a setup may or may not make sense.
Technology should not replace learning.
It should make the learning process easier to apply.
Conclusion
Support and resistance become far more useful when they are not treated as magic lines.
RSI should not be reduced to:
“30 means buy and 70 means sell.”
Fibonacci should not be treated as a prediction tool.
Ichimoku should not be used simply because the chart looks sophisticated.
Each tool answers a different question.
The real value comes when you connect them:
Trend + Level + Momentum + Timeframe + Confirmation
That is the difference between learning technical indicators and learning technical analysis.
Learn How to Apply Technical Analysis
If you are new to the market and want to understand these concepts practically instead of only memorising definitions, explore NeoTrader’s learning resources or book a guided product walkthrough.
(Disclaimer: For educational and informational purposes only. Trading and investing involve market risk. Technical indicators, support and resistance levels, and confirmation methods do not guarantee trading outcomes. NeoTrader supports technical analysis and decision-making; it does not eliminate market risk.)
Like what you see? Share with a friend.


