









RSI vs Ichimoku vs Fibonacci: What Does Each Indicator Actually Tell You?
Which Indicator Is Best — RSI, Ichimoku or Fibonacci?
This question assumes that every technical indicator is designed to perform the same job. It isn’t. Different indicators answer different technical-analysis questions.
• RSI helps evaluate momentum.
• Ichimoku provides context about the trend structure.
• Fibonacci retracement identifies potential reaction zones after a directional move.
Instead of asking “Which indicator should replace the others?”, ask:
“What information am I trying to understand?”
RSI: What Is Momentum Doing?
RSI is commonly used as a momentum indicator. Beginners often reduce it to two readings: Above 70 = Overbought, Below 30 = Oversold.
But momentum analysis can be more nuanced. RSI can help traders observe whether bullish or bearish momentum is strengthening, weakening or changing character.
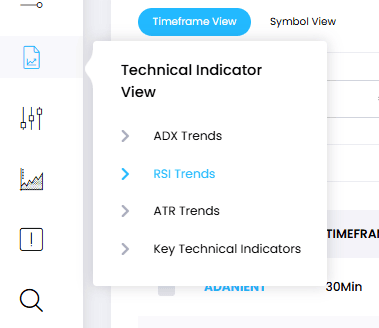
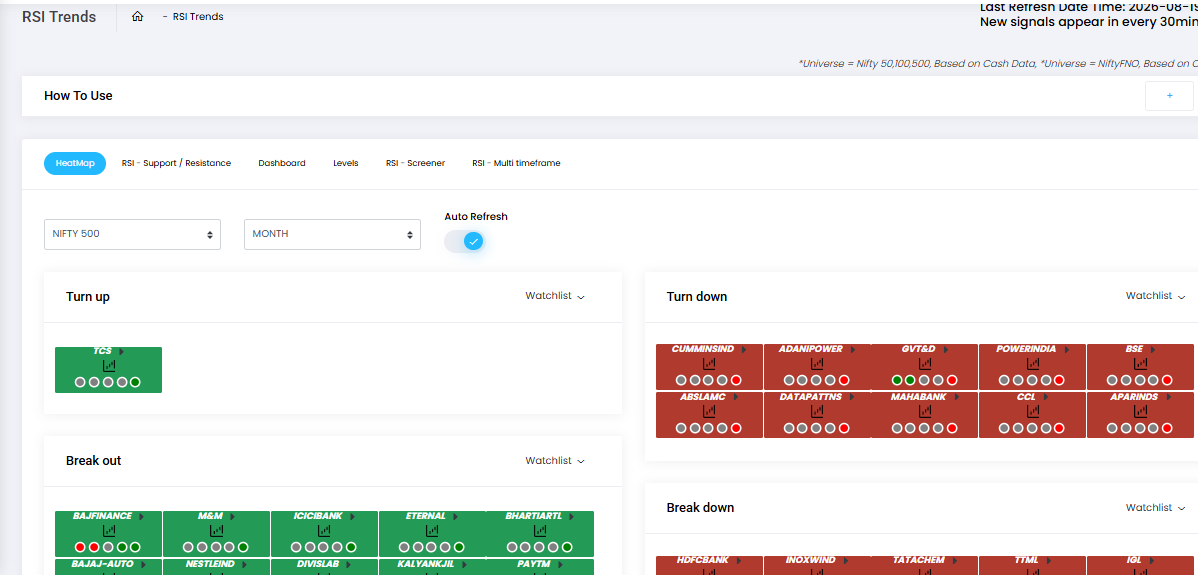
A stock can remain strong even when RSI is elevated. Similarly, an oversold RSI does not automatically mean that price will reverse. NeoTrader includes RSI-related technical views that can be used alongside other technical information instead of relying on one reading in isolation. The main question RSI helps answer is:
“How strong is the current momentum?”
Ichimoku: What Is the Trend Structure?
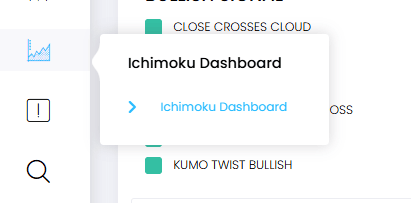
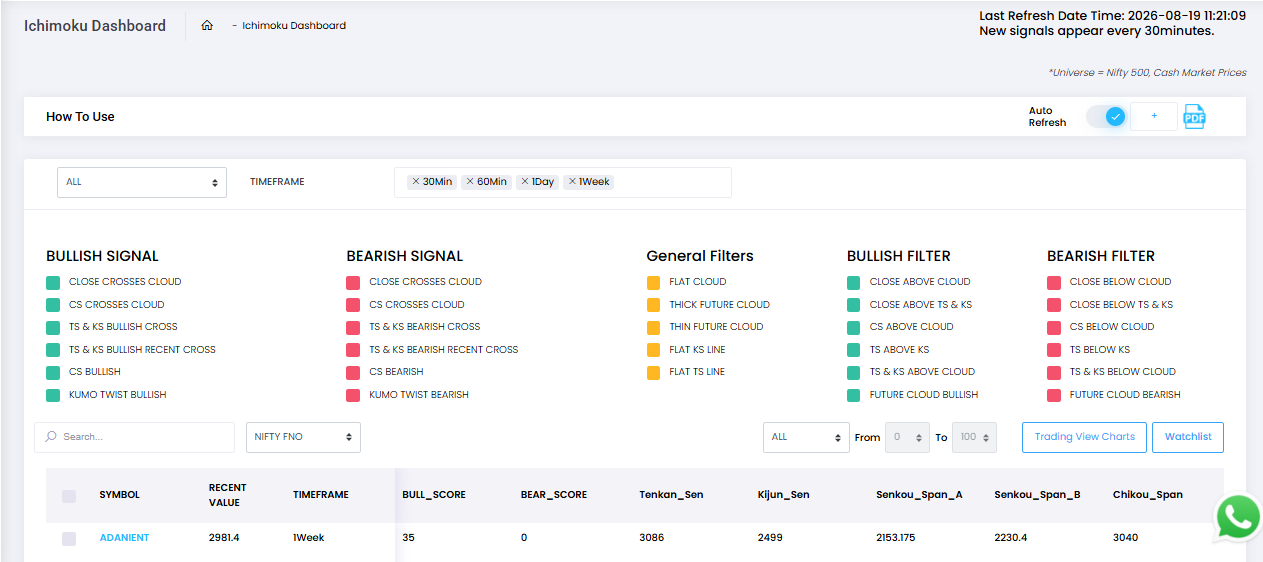
Ichimoku provides a different type of information. Ichimoku information within Stock Analyzer can help users understand whether price is positioned above or below important structural areas. The broader question is:
“Is price structurally strong, weak or unclear?”
• If price is clearly above the Ichimoku cloud, the bullish structure may be stronger.
• If price is below the cloud, the market structure may remain weak.
• If price repeatedly moves through the cloud, the direction may be unclear.
You do not need to memorise every Ichimoku component on Day 1. Start by understanding what the overall structure says about the trend.
Fibonacci: Where Could Price React?
Fibonacci retracement addresses a different technical question. Suppose a stock makes a strong directional move and then begins pulling back.
Where could that pullback find support or resistance?
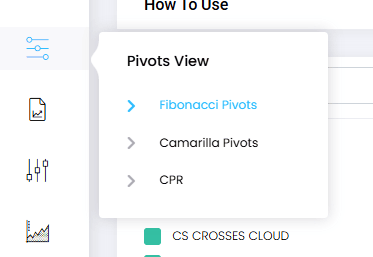
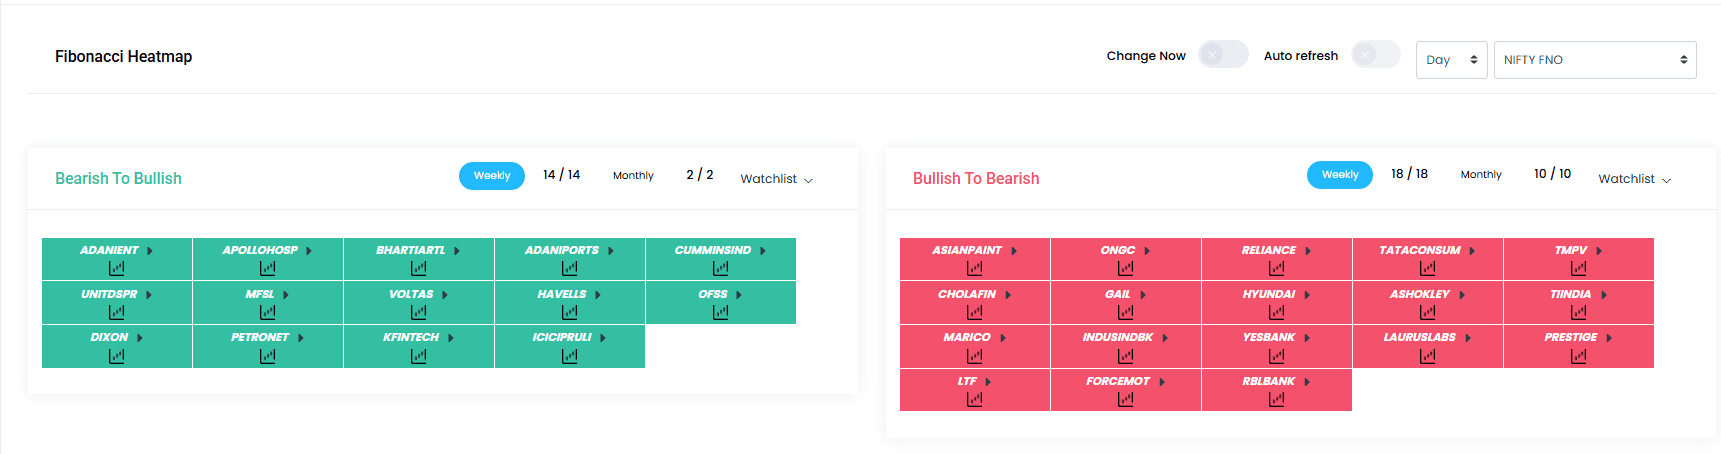
Fibonacci levels provide reference zones that traders can monitor. They are not guarantees. A Fibonacci level does not mean: “Price must reverse here.” It means: “This is an area worth observing.” The level becomes more meaningful when it aligns with other technical evidence, such as previous support, resistance, momentum or price behaviour.
What Does Each Indicator Tell You?
| Indicator | Main Purpose | Question It Helps Answer |
|---|---|---|
| RSI | Momentum | Is momentum strengthening or weakening? |
| Ichimoku | Trend structure | Is price structurally strong, weak or unclear? |
| Fibonacci retracement | Potential reaction zones | Where could a pullback find support or resistance? |
| Price behaviour | Confirmation | Is the market actually reacting at the identified level? |
These indicators should not compete with one another.
They are designed to provide different types of information.
What Happens When the Indicators Agree?
Imagine:
• The broader trend structure remains bullish
• RSI shows healthy momentum
• Price has pulled back towards an important technical zone
• Price behaviour begins supporting the setup
That is more meaningful than one indicator providing an isolated observation. A stronger technical workflow moves from identification to confirmation before execution. NeoTrader supports this progression through technical screening, watchlists, Rolling Ticker and Stock Analyzer.
Identify → Confirm → Analyse → Decide
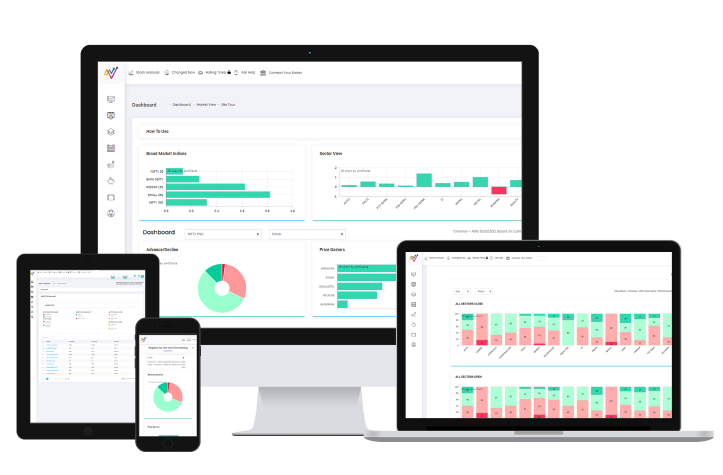
Start With the NeoTrader Dashboard
Even the best stock-level indicator should be viewed within the broader market environment. Start with the NeoTrader Dashboard and ask:
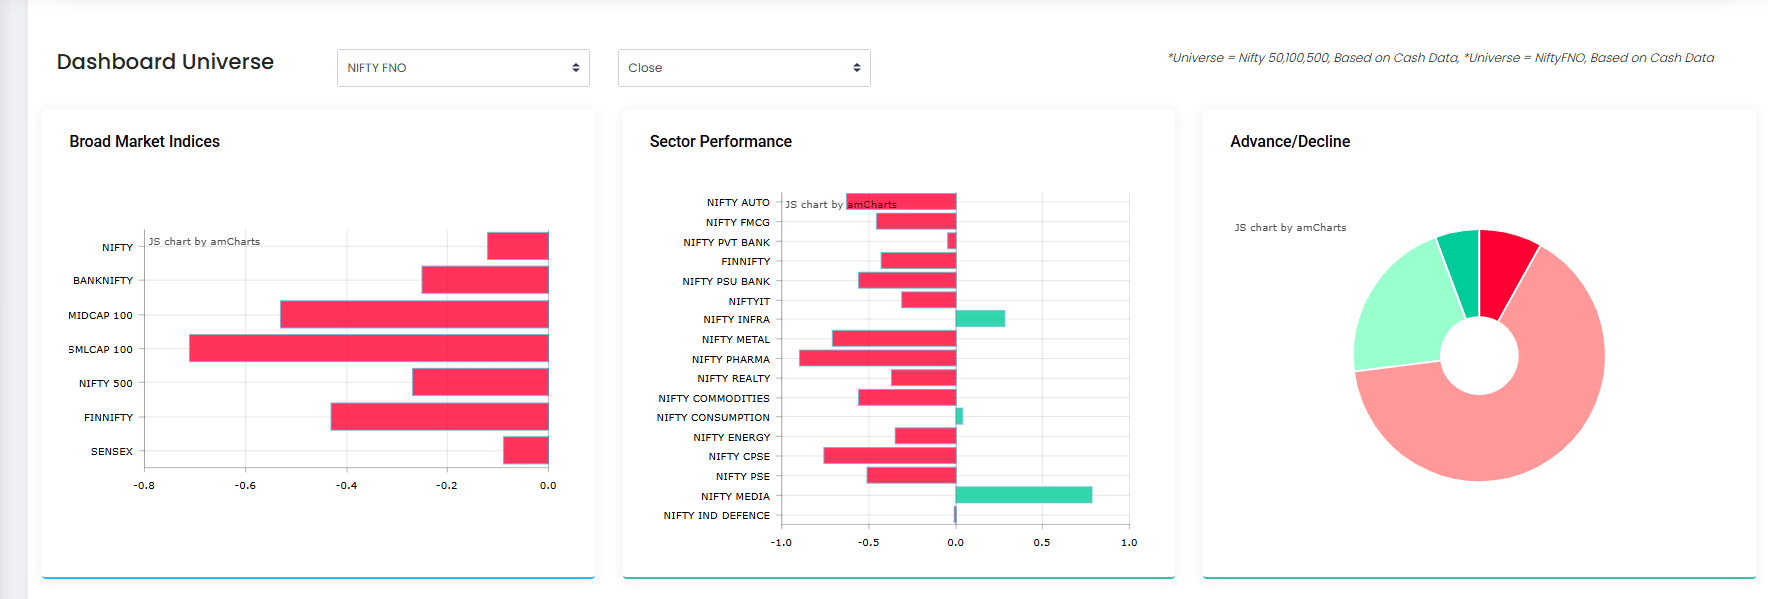
• What is the overall market doing?
• Is market participation bullish, bearish or mixed?
• Which sectors are showing strength?
• Is the stock aligned with its sector?
Then move to the individual stock. Now the technical indicators have context.
Market → Sector → Stock → Technical Confirmation
Don’t Add Indicators Just to Feel Certain
A chart containing eight indicators is not automatically better than one containing three. If you do not understand what each indicator contributes, adding more can simply create more noise. Use:
• RSI for Momentum
• Ichimoku for Trend Context
• Fibonacci for Potential Reaction Zones
• Price Behaviour for Confirmation
The objective is not to make the chart look more sophisticated. The objective is to understand what each tool contributes to the decision.
Use Stock Analyzer for the Final Review
NeoTrader’s Stock Analyzer brings individual-stock technical information and important levels into a more consolidated analysis view. It is most useful after a stock has already been shortlisted and deserves deeper review.
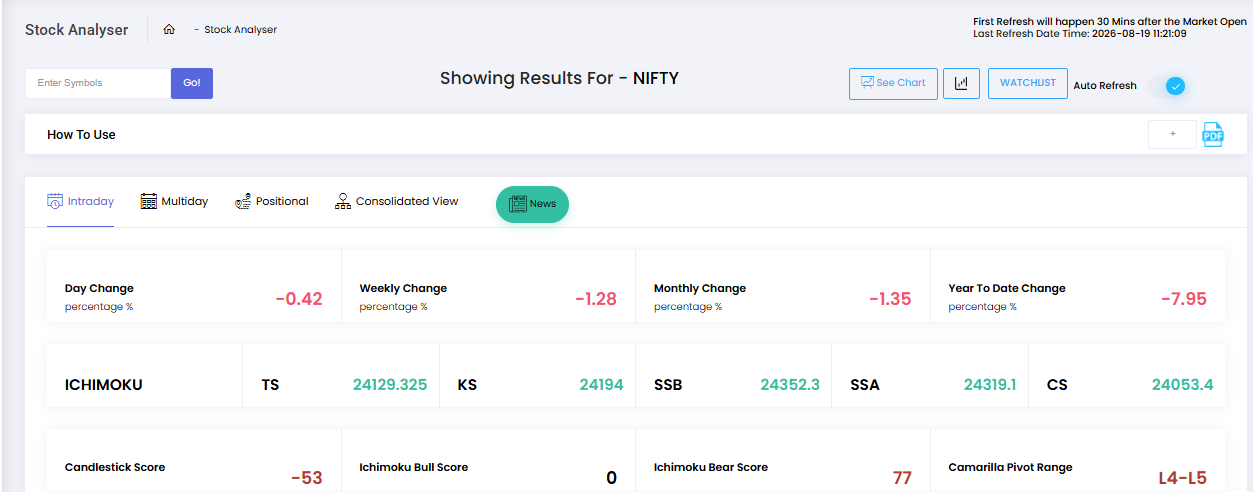
The correct sequence is not Open Stock Analyzer → Search for a Reason to Trade. Instead, use:
Identify → Confirm → Analyse → Decide
This keeps Stock Analyzer within a structured trading process rather than using it to justify a trade you already want to take.
Conclusion
RSI, Ichimoku and Fibonacci should not compete for the title of the “best indicator.” They answer different questions. The real skill lies in connecting their information without overcomplicating the chart. The objective is:
Trend + Momentum + Level + Market Context
NeoTrader can help bring these stages into one practical workflow through the Dashboard, technical views and Stock Analyzer. Learn what each indicator tells you—and then use NeoTrader to understand how the complete process fits together.
Want to see how these views fit together inside the platform? Book a personalised NeoTrader walkthrough with our team.
(Disclaimer: For educational and informational purposes only. Trading and investing involve market risk. Technical indicators and confirmation methods do not guarantee profitable outcomes. NeoTrader supports technical analysis and decision-making; it does not eliminate market risk.)
Like what you see? Share with a friend.


