








Nifty Is Up but Your Stock Is Falling? Here's Why
Nifty 50 Is Up. Your Stock Is Down. How Is That Possible?
New traders often assume that if the headline index is bullish, every stock should also rise. But the stock market does not work that way. The Nifty 50 is an index made up of selected stocks with different weightages. Individual sectors can move differently.
Individual companies can move differently. Sometimes, the headline index can look strong while the broader market underneath it remains weak. That is why looking only at the Nifty can give you an incomplete view of the market.
Start With Market Breadth
Market breadth helps answer one important question:
How many stocks are actually participating in the move?
If a large number of stocks are advancing, the bullish move has broad participation. If only a few major stocks are pushing the index higher while many others remain weak, market participation is narrow.
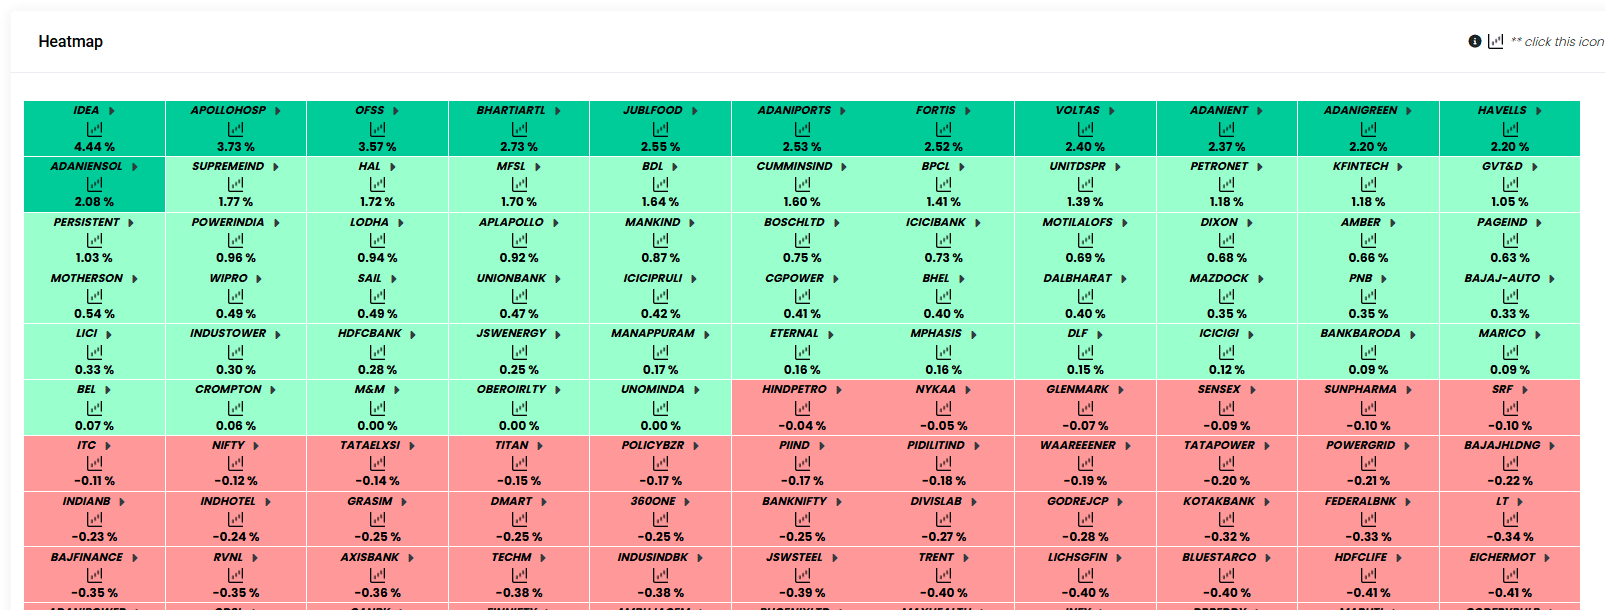
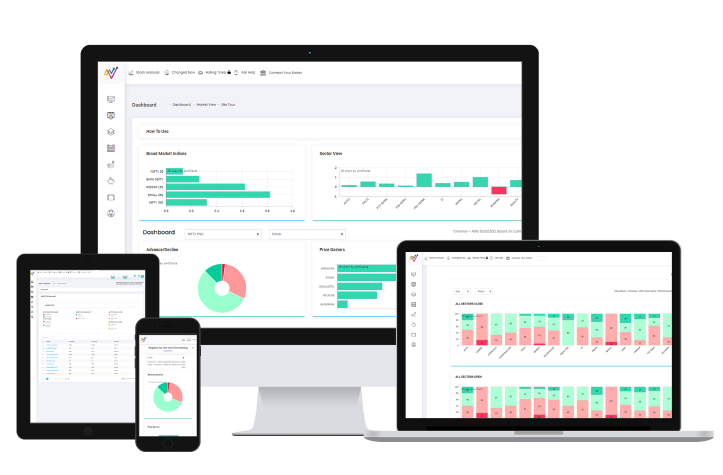
NeoTrader's Dashboard uses advance-decline information and a heat-map structure to show broader bullish and bearish participation.
This gives you more context than simply seeing:
Nifty: +0.5% — and assuming that the entire stock market is bullish.
Then Look at the Sector
Suppose the Nifty is positive because banking and financial stocks are strong.
But your stock belongs to the IT sector. If IT stocks are weak, the Nifty's positive direction may not help your stock. This is why a top-down approach works well:
Market → Sector → Stock
The market gives you the broader context. The sector shows you where strength or weakness is concentrated. The stock gives you the individual opportunity. Skipping the sector step can create confusion.
A Simple Example
• Nifty: +0.6%
• Banking: Strong
• Auto: Strong
• IT: Weak
• Your Stock: IT Company
You ask:
“Market bullish hai, mera stock kyun gir raha hai?”
The answer may simply be:
Your sector is not participating.
Previous Close and Today's Open Can Tell Different Stories
A market can be positive compared with yesterday's closing price but weak compared with today's opening price.
For example:
• Yesterday's Close: 100
• Today's Open: 105
• Current Price: 102
Compared with yesterday's close, the stock is still positive. Compared with today's open, the stock has weakened. This suggests that sellers took control after the market opened. NeoTrader's Dashboard helps users compare performance from both the previous close and the current day's open. This can provide a clearer picture of what happened after trading began.
Don't Select the Stock First
A common trading process is:
Find Stock → Analyse Chart → Take Trade → Check Nifty Later
Reverse that process. Start with the NeoTrader Dashboard. Then study the relevant sector. Only then move towards the individual stock. The better process is:
Market → Sector → Stock → Confirmation → Decision
This does not mean that every trade aligned with the market will work.
It means you are adding useful context before making the decision.
How NeoTrader Can Help
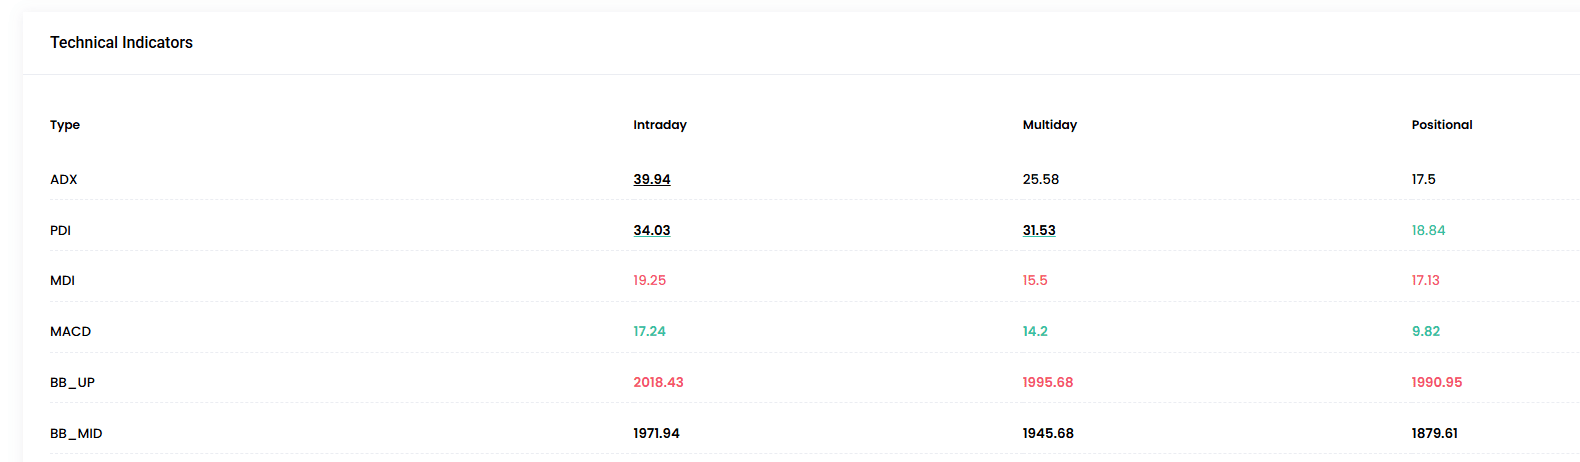
The NeoTrader Dashboard can help answer:
• Are bulls or bears dominating?
• Is the market relatively neutral?
• How broad is the current move?
• Which sectors are participating?
• What has happened since the market opened?
• Which parts of the market deserve attention?
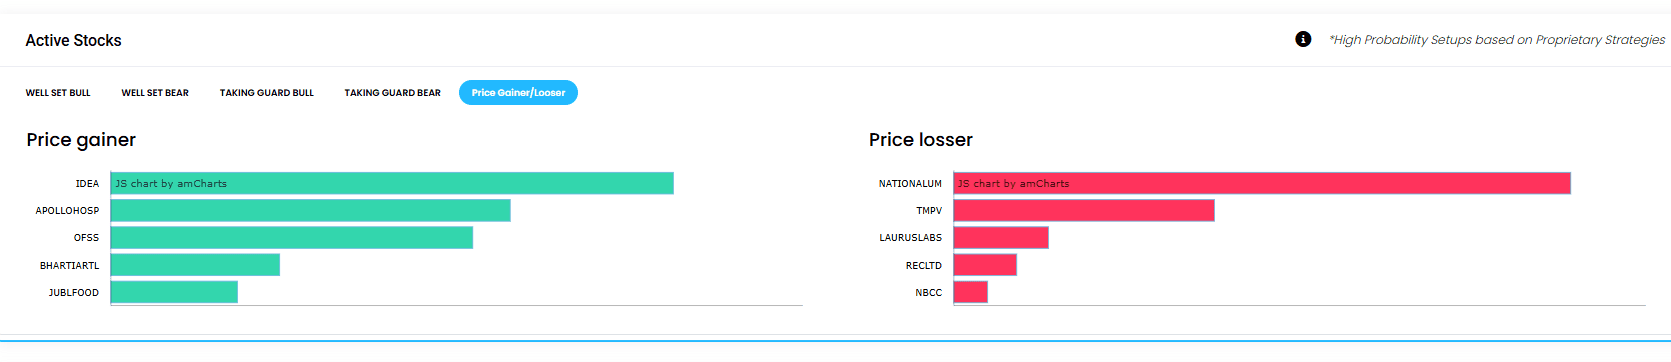
Once the broader picture is clearer, stock-level tools such as Active Stocks, Rolling Ticker and Stock Analyzer can be used for further analysis.
Conclusion
The Nifty being green does not mean that every stock is bullish.
The important questions are:
• How broad is the rally?
• Which sectors are leading?
• Is your stock participating?
• What has happened since the market opened?
The next time the Nifty rises while your stock falls, do not immediately blame the stock.
Zoom out. Look at the complete market structure first. Use the NeoTrader Dashboard to follow the:
Market → Sector → Stock
approach before making your next trading decision.
Want to see the Market → Sector → Stock view in action? Book a personalised NeoTrader walkthrough with our team.
(Disclaimer: For educational and informational purposes only. Trading and investing involve market risk. Index performance, market breadth and sector strength do not guarantee the performance of an individual stock. NeoTrader supports technical analysis and decision-making; it does not eliminate market risk.)
Like what you see? Share with a friend.


