









How to Use Time Cycles & Turn Dates in NeoTrader
Markets do not move only according to price. Time can also play an important role in identifying when a stock may be approaching an important decision point. NeoTrader's Time Cycles & Turn Dates feature is designed to help traders identify these important time windows in advance.
Instead of continuously watching hundreds of stocks and waiting for something to happen, traders can use NeoTrader to answer a different question:
Which stocks are approaching an important time window right now?
However, there is one important point to understand before using the feature: A Turn Time does not automatically mean Buy or Sell. The Turn Time tells you when to pay attention. The price action around that time helps you understand what action, if any, may be considered. This guide explains the complete workflow.
What Are Time Cycles in NeoTrader?
Time Cycles are calculated time points at which a particular stock may be approaching an important market reaction. For intraday traders, NeoTrader displays these as specific times during the trading session.
For example, Hindustan Unilever:
• Time 1 — 10:22 AM
• Time 2 — 11:44 AM
• Time 3 — 1:06 PM
These times are not generic market times. They are calculated specifically for that stock. That means Hindustan Unilever may have one set of Turn Times while another stock may have completely different times. The purpose is to help traders focus their attention on a stock when its calculated time cycle becomes relevant.
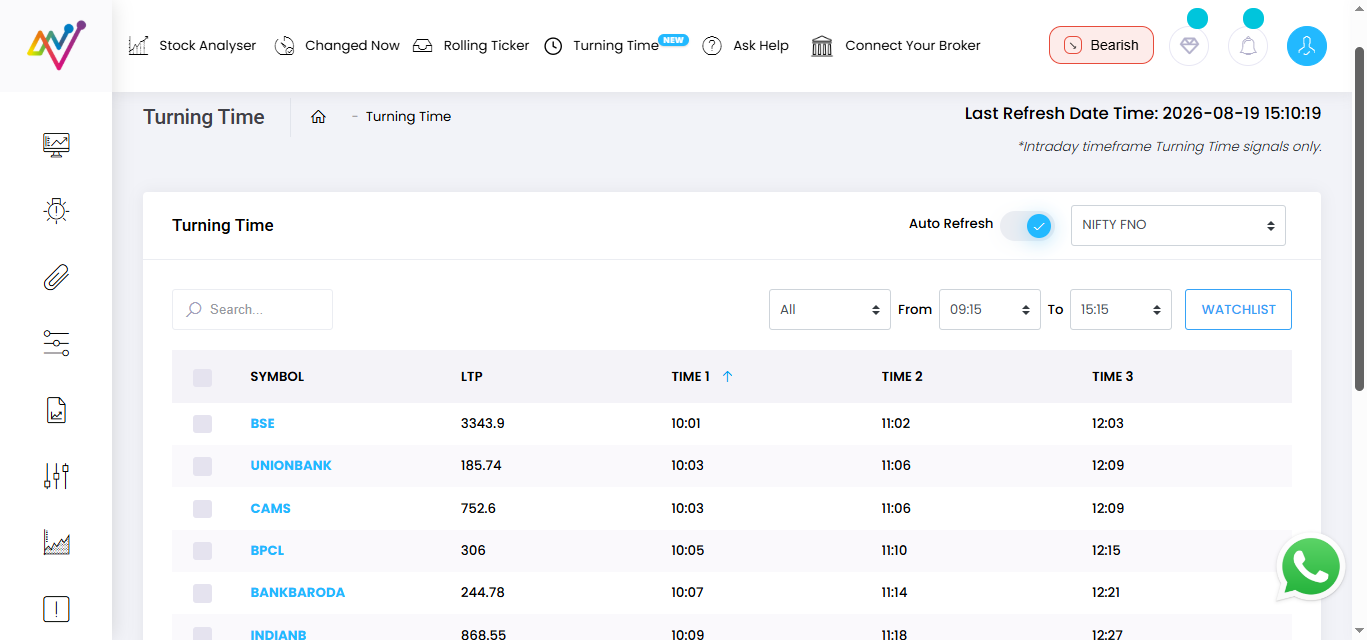
NeoTrader identifies stock-specific Turn Times across the trading session.
Understanding Time 1, Time 2 and Time 3
NeoTrader can display up to three significant intraday time points for a stock:
• Time 1 — First important time window
• Time 2 — Second important time window
• Time 3 — Third important time window
These should not automatically be treated as three separate trade signals. Instead, think of them as decision checkpoints during the trading session. At every checkpoint, you evaluate what price is doing.
A stock may:
• reverse around the Turn Time;
• continue its existing trend;
• remain inside the same range without giving confirmation.
The price action decides which scenario is developing.
Step 1: Open the Time Cycles Section
Open the Time Cycles / Turning Time section inside NeoTrader. The dashboard provides a list of stocks along with their calculated Turn Times. Depending on the selected universe, you can view a broader list of stocks and search for an individual symbol directly.
Rather than opening hundreds of charts manually, the page helps you identify stocks that are approaching relevant time windows.
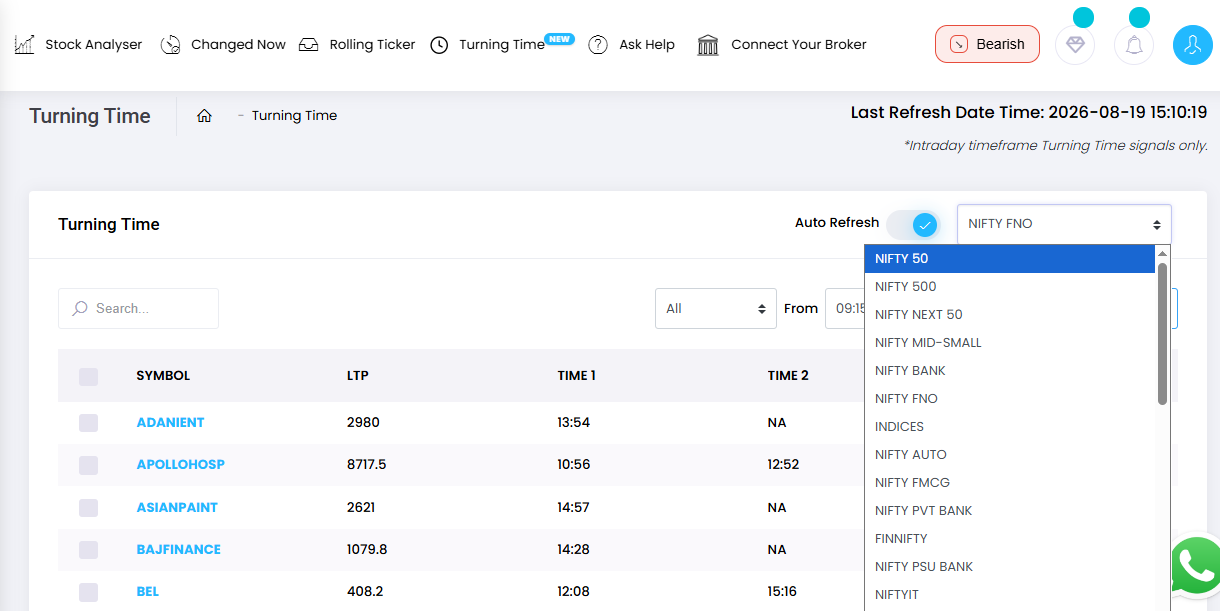
Search for an individual stock or scan stocks with upcoming Turn Times.
Step 2: Narrow the List by Time
One of the most useful applications of the feature is filtering stocks according to when their Turn Time is approaching. Suppose the market has opened and you want to identify stocks with a Turn Time between 9:15 AM and 10:45 AM.
Instead of studying the entire day's list, select the appropriate time filter. NeoTrader will narrow the list to stocks relevant within that period. This makes the feature particularly useful for active intraday traders. You can repeat the process later in the session to identify stocks approaching Time 2 or Time 3.
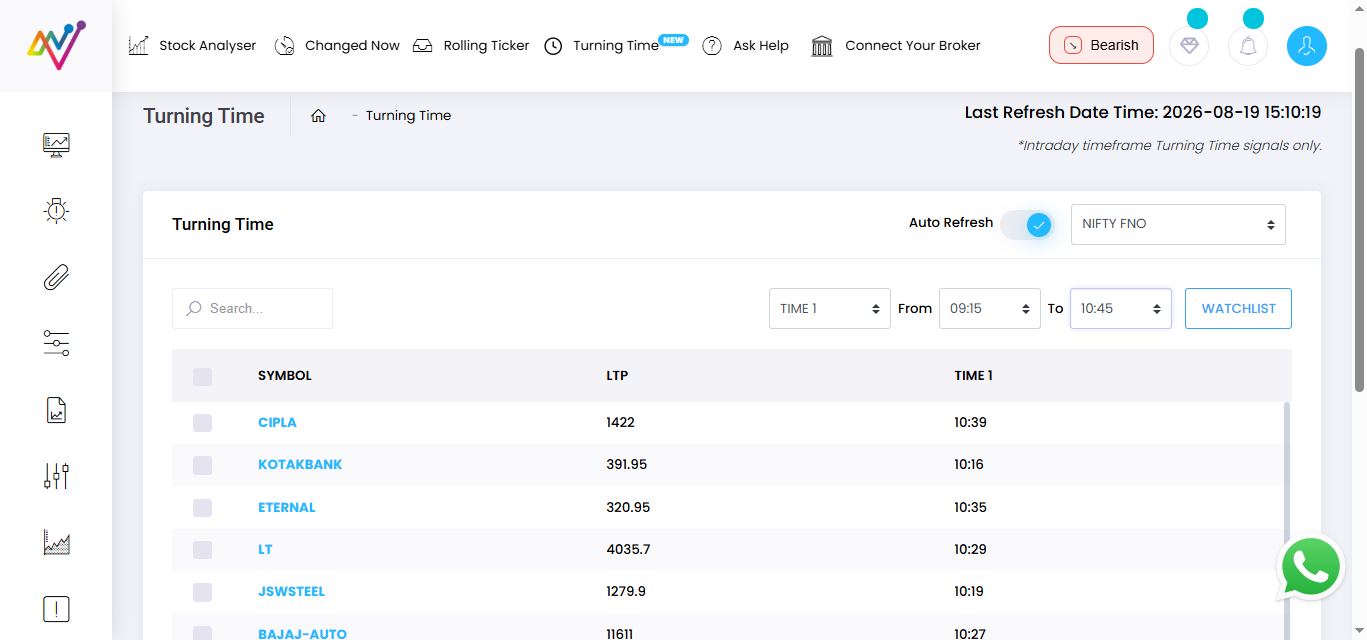
Use the time filter to focus only on stocks approaching an important Turn Time.
Step 3: Select the Stock and Open Its Chart
Once you identify a stock approaching its Turn Time, select it and examine the chart. For intraday analysis, charts such as 5-minute, 10-minute or 15-minute can be used depending on the trader's preferred workflow.
A 5-minute chart can be useful when you want to closely study the price behaviour around the exact Turn Time. In the newer NeoTrader workflow, selecting the stock can bring the relevant chart and information together on the same page, reducing the need to switch between multiple screens.
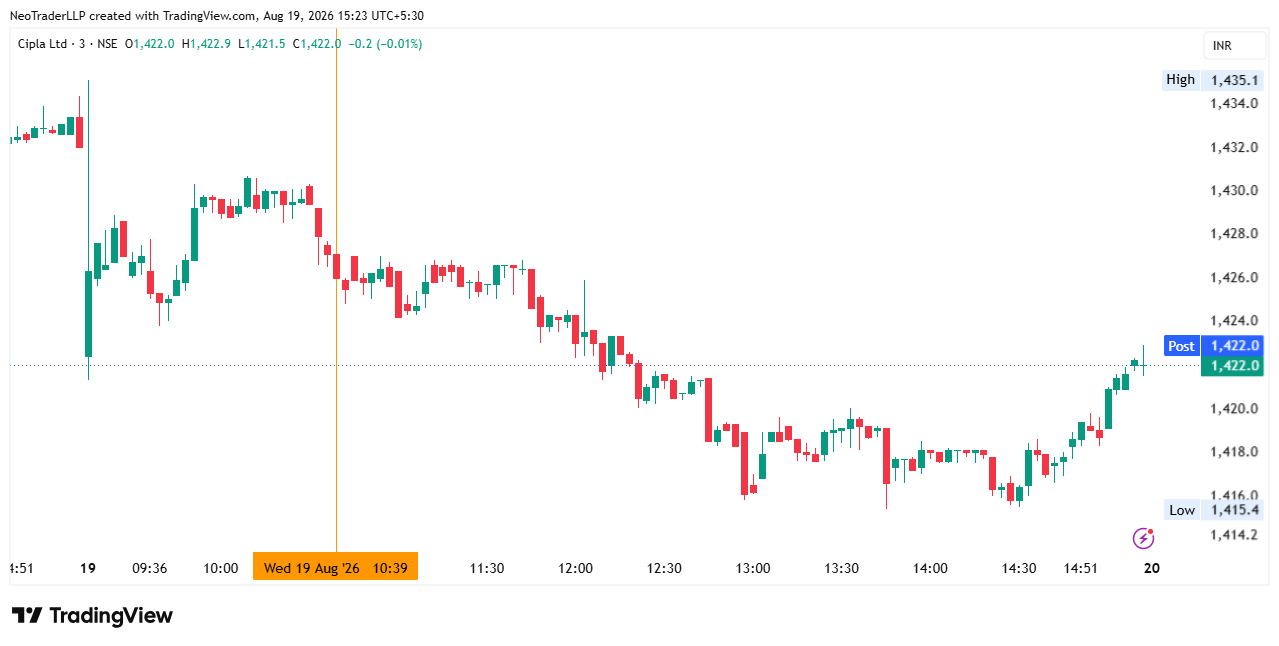
Selecting the stock allows the trader to analyse price behaviour around its Turn Time.
Step 4: Find the Candle Around the Turn Time
Suppose NeoTrader displays a Turn Time of 10:22 AM. On a 5-minute chart, identify the candle or price area corresponding approximately to that time.
The key objective is not simply to see that the clock has reached 10:22. You need to observe the price structure created around the Turn Time. This is where the actual interpretation begins.
Step 5: Mark the High and Low Around the Turn Time
Mark the price range around the Turn Time. A simple way of doing this is to create a small zone or rectangle covering the relevant High and Low of the Turn-Time price area. You can think of this as the stock's decision zone.
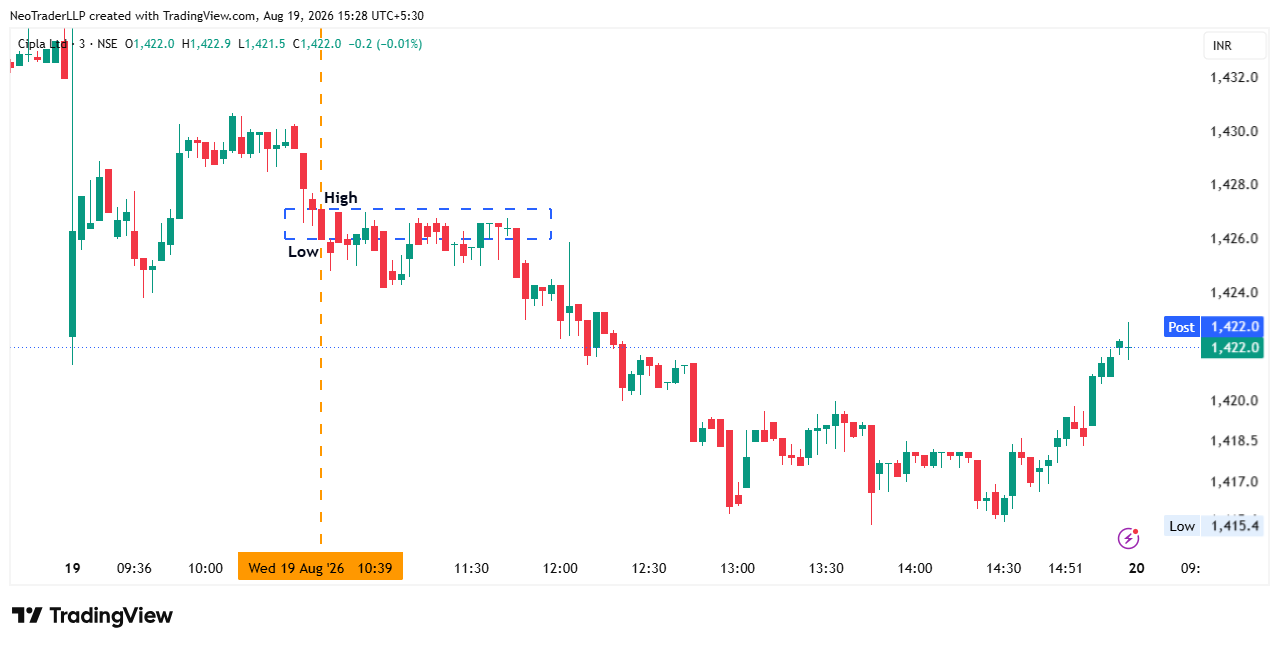
Mark the price range around the Turn Time. The subsequent break helps confirm direction.
Step 6: Let Price Confirm the Direction
This is the most important part of the entire feature. The Turn Time tells you when to watch. The price tells you which direction is gaining control.
Scenario A — Price Breaks Above the Turn-Time Zone
If price decisively moves above the Turn-Time high or trigger level, it can indicate that bullish momentum is taking control. The Turn Time may therefore become a continuation or bullish decision point.
Scenario B — Price Breaks Below the Turn-Time Zone
If price breaks below the Turn-Time low or trigger level, it can indicate bearish control. The Turn Time may therefore develop into a bearish continuation or reversal point.
Scenario C — Price Remains Inside the Zone
Sometimes nothing meaningful happens immediately. Price may remain inside the range or move sideways. In that situation, the Turn Time has not provided directional confirmation. There is no need to force a trade simply because a Turn Time has occurred.
Example A:
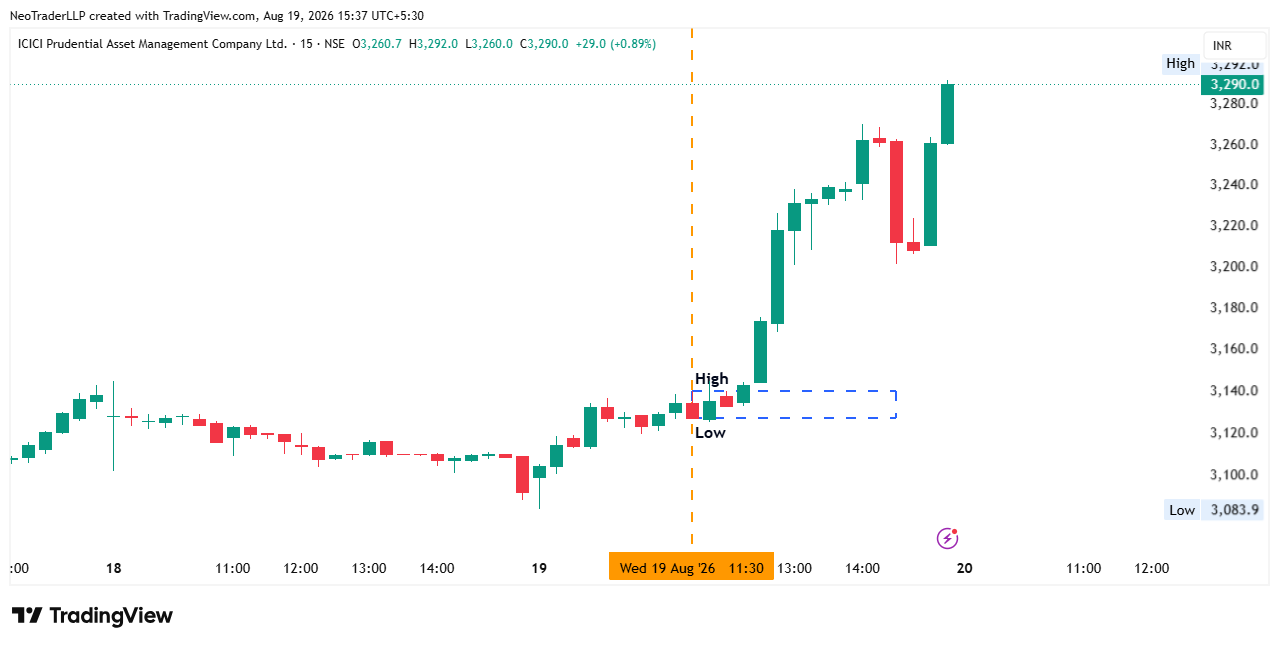
Example B:
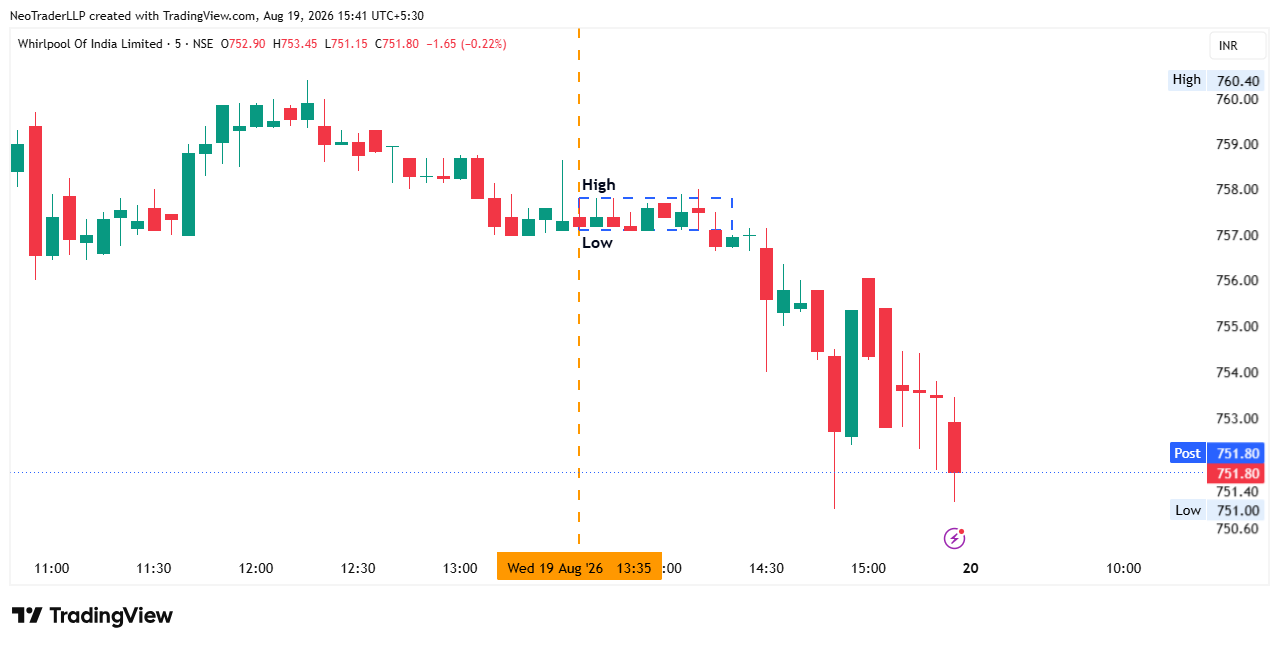
Turn Time identifies the decision point; price confirmation determines the directional interpretation.
Turn Time Can Mean Reversal OR Continuation
This distinction is critical. Many traders may initially assume:
“If NeoTrader says the Turn Time is 10:22 AM, does that mean the stock will reverse at 10:22?”
No. A Turn Time should not be interpreted as an automatic reversal prediction. At the Turn Time, the stock can either reverse its existing move, or continue in the existing direction. That is why the high-low zone and subsequent price behaviour are important.
Think of Turn Time as a market decision window rather than an automatic Buy/Sell signal.
Step 7: Use the Next Turn Time as Another Decision Point
A stock can have more than one Turn Time during the day. For example:
• Time 1 — 10:22 AM
• Time 2 — 11:44 AM
• Time 3 — 1:06 PM
Suppose the stock breaks down after Time 1. The trader now has a bearish indication. When Time 2 approaches, observe the market again. Does the stock continue to remain weak? Does it break another relevant price level? Or does it recover above the Turn-Time range?
This allows Time 2 to work as a form of confirmation or reassessment. The same process can be repeated at Time 3.
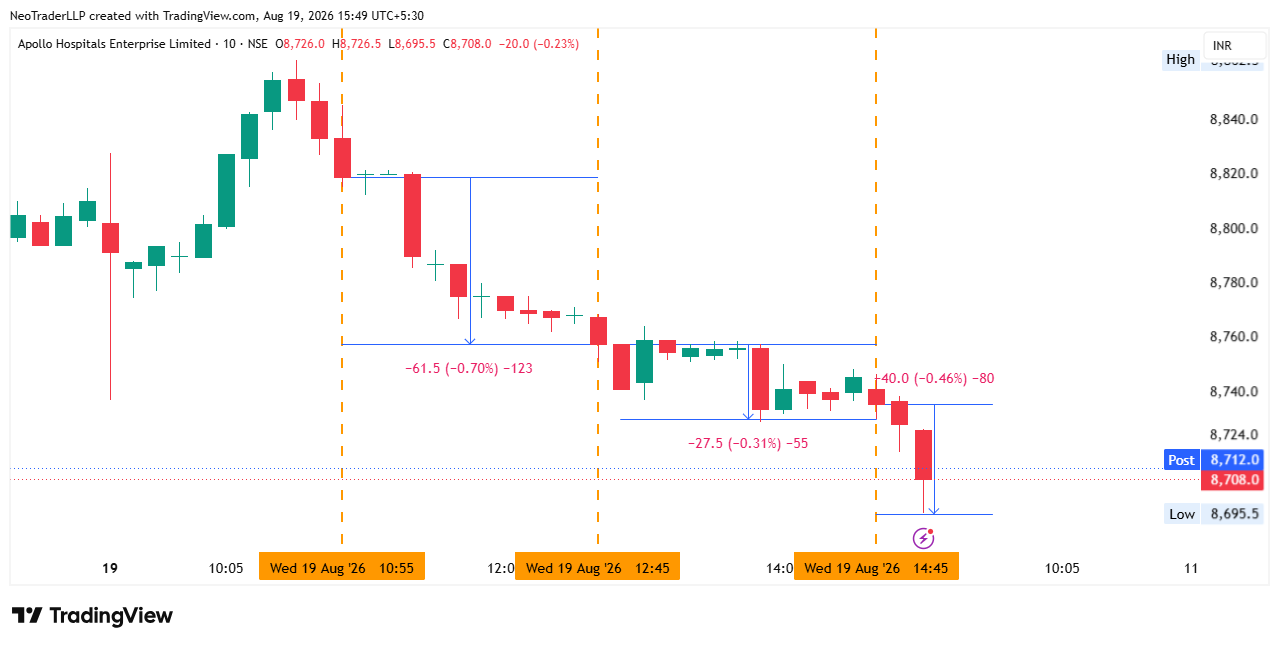
Multiple Turn Times provide checkpoints for confirming, reassessing or managing an intraday move.
Using Turn Times for Trade Management
The feature can also be useful when you are already in a trade. Suppose you entered a short trade and the stock has moved in your favour. The next Turn Time is approaching. Rather than making an emotional decision about whether to continue holding or exit, the Turn Time gives you another structured point at which to reassess the trade.
You can ask:
• Has the stock already delivered a meaningful move?
• Is momentum continuing?
• Has the Turn-Time zone been broken?
• Is the trend holding?
• Is the price showing signs of reversal?
Depending on the complete trade setup and risk-management plan, the trader may use the next Turn Time as an additional reference for managing the position. It should not be treated as a compulsory exit.
Add the First 5-Minute Range as an Additional Filter
Another useful confirmation discussed for the Time Cycle workflow is the first 5-minute high and low. At the beginning of the trading session, identify the First 5-Minute High and First 5-Minute Low. Now compare the stock's current position with this opening range.
Bullish Context
If the stock has moved above its first 5-minute high and continues to remain above it, the stock has stronger bullish intraday context. A bullish Turn-Time confirmation may therefore become more relevant.
Bearish Context
If the stock has broken below its first 5-minute low and continues to trade below it, the stock has bearish intraday context. A bearish Turn-Time confirmation may therefore have stronger context.
Still Inside the First 5-Minute Range
If the stock has neither crossed the first 5-minute high nor broken the first 5-minute low, there may not yet be enough directional movement. Even if multiple Turn Times appear, the stock may continue to remain range-bound until price confirms a breakout.
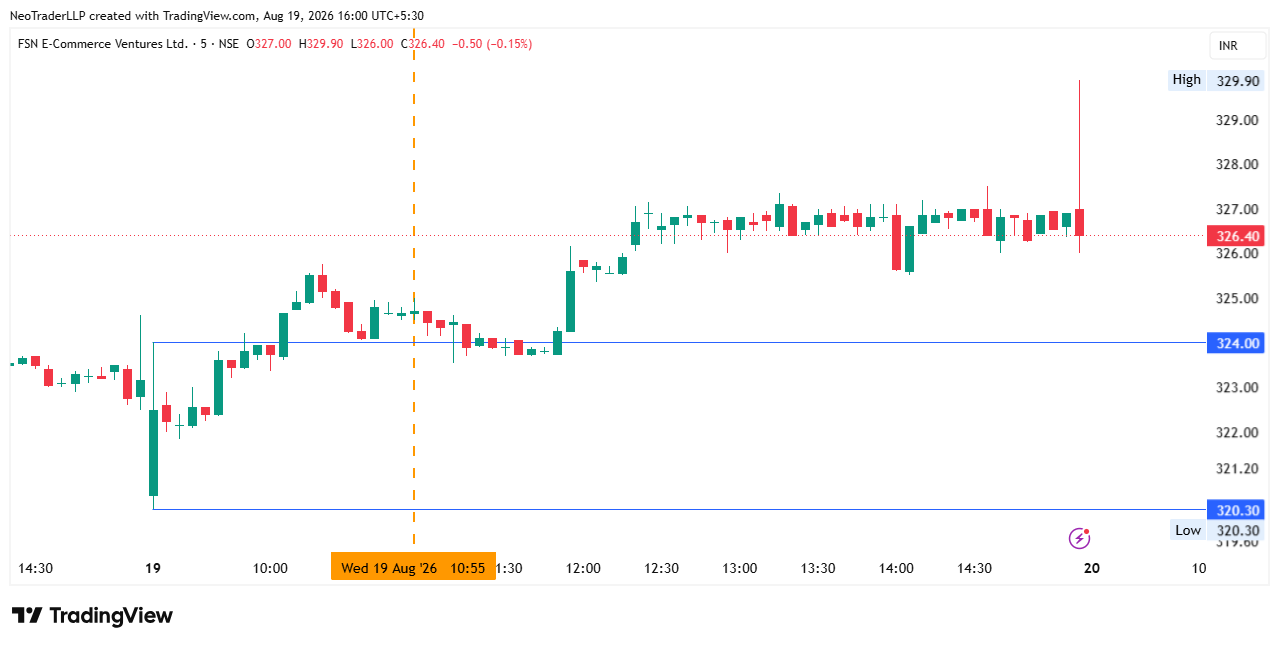
The first 5-minute range can provide an additional layer of intraday directional confirmation.
Putting the Complete Workflow Together
A practical Time Cycle workflow can therefore look like this:
1. Identify the Stock — Open NeoTrader's Time Cycles section and find stocks with an upcoming Turn Time.
2. Check the Time — Use Time 1, Time 2 or Time 3 and narrow the stock list according to your preferred trading window.
3. Open the Chart — Study the stock on an appropriate intraday timeframe.
4. Check the First 5-Minute Range — See whether the stock is above the first 5-minute high, below the first 5-minute low, or still inside the opening range.
5. Locate the Turn Time — Find the relevant candle or price area around the calculated Turn Time.
6. Mark the Decision Zone — Mark the relevant high and low or use the Trigger Price displayed by NeoTrader where available.
7. Wait for Price Confirmation
• Above the range → Bullish confirmation
• Below the range → Bearish confirmation
• Inside the range → No clear confirmation
8. Monitor the Next Turn Time — Use Time 2 and Time 3 as additional points for confirmation, reassessment or trade management.
Example: Understanding the Workflow
Consider a stock with the following calculated Turn Times: 10:22 AM, 11:44 AM and 1:06 PM.
At 10:22 AM, the stock reaches its first important time window. You mark the relevant high and low. Price then moves below the Turn-Time range. This provides bearish confirmation. The stock remains weak until the next Turn Time.
At approximately 11:44 AM, another decision point appears. If price again fails to recover above the relevant level and continues lower, the bearish move receives additional confirmation. At 1:06 PM, the same process can be repeated.
The trader is therefore not blindly acting at three different times. Instead, the three Turn Times are helping the trader structure the way the stock is monitored throughout the trading session.
Why This Workflow Is Useful
An active trader normally has hundreds of stocks to choose from. The challenge is not simply finding another indicator. The bigger challenge is knowing:
Which stock should I pay attention to right now?
Time Cycles help narrow that decision. Instead of watching every chart throughout the day, traders can identify stocks approaching their calculated time windows and then apply price confirmation. The feature therefore brings together:
Stock Selection → Time → Price → Confirmation → Trade Management
into one structured workflow.
Three Mistakes to Avoid
1. Assuming Every Turn Time Means Reversal
A stock can reverse or continue. Always wait for price confirmation.
2. Entering Simply Because the Turn Time Has Arrived
Time alone is not an entry trigger. Check the relevant price zone, trend and market context.
3. Ignoring Risk Management
No time cycle can guarantee how a stock will behave. Turn Times and Turn Dates should be treated as analytical inputs within a broader trading and risk-management process.
A Simple Rule to Remember
If you remember only one thing from this guide, remember this:
NeoTrader's Time Cycle tells you WHEN to look. Price tells you WHAT the stock is doing.
Use both together. That is the core of the Time Cycles and Turn Dates workflow.
Conclusion
NeoTrader's Time Cycles & Turn Dates feature adds another dimension to market analysis by combining price with time. For an intraday trader, Turn Times can help identify when a stock is approaching an important decision window during the session. For longer-duration analysis, Turn Dates can highlight important dates where traders may need to pay closer attention to price behaviour.
But neither should be viewed as automatic Buy or Sell signals. The practical workflow is:
Identify the Turn Time → Check the chart → Mark the price zone → Wait for confirmation → Monitor the next time cycle.
Used this way, Time Cycles can help traders reduce random chart-watching and bring more structure to stock selection, timing and trade management.
Want to see the Time Cycles & Turn Dates workflow in action? Book a personalised NeoTrader walkthrough with our team.
Quick Reference
• Turn Time tells you: When to watch
• Trigger / price zone tells you: What level matters
• Price breakout tells you: Which direction is confirming
• Next Turn Time tells you: When to reassess
• Turn Date tells you: When to pay attention on a longer timeframe
(Disclaimer: The information provided is for educational purposes only. Time Cycles, Turn Times and Turn Dates are analytical tools and do not guarantee market direction, price movement or trading outcomes. Traders should use appropriate confirmation and risk-management practices before making trading decisions.)
Like what you see? Share with a friend.


