

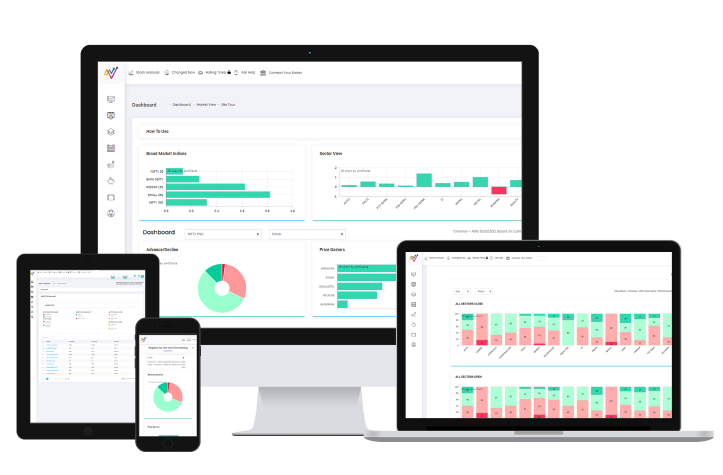








Beyond the Chart, How Serious Traders Combine Macro Signals, Sector Strength and NeoTrader
A Good Chart Is Not Always a Good Trade
An experienced trader usually knows how to read a chart:
• Trend
• Momentum
• Breakout
• Support
• Resistance
But the more serious question is:
Why is this stock moving in the first place?
A technically strong setup can become more meaningful when it is supported by a larger market narrative.
• Interest rates can influence capital flows.
• Currency movements can affect exporters and importers differently.
• Commodity prices can change input costs.
• Government expenditure can create opportunities across entire industries.
• Quarterly results can indicate whether a sector’s fundamental story is actually developing.
Instead of viewing equities in isolation, serious market participants can study the connections between currencies, bonds, commodities, government policy, sectors and, finally, individual companies.
For serious market participants, this creates an important shift:
Don’t start with the stock. Start with the environment in which the stock operates.
The Three Layers Behind a Trade
A structured market decision can broadly be divided into three layers.
Layer 1: Understand the Macro Environment
Ask:
• Where are interest rates moving?
• What is happening to the rupee?
• How are global capital flows behaving?
• Are important commodities becoming more expensive?
• Which areas are receiving policy support?
The objective is not to become an economist.
It is to understand which forces may be helping or hurting different parts of the market.
Interest Rates Are More Than an RBI Headline
When global interest rates change, the impact is not restricted to bond traders.
Changes in borrowing costs can affect where institutional capital prefers to move.
Global interest rates can influence international capital flows and, in turn, emerging markets such as India.
For an equity trader, the useful question is therefore not:
“Will the Fed cut rates?”
It is:
“If global liquidity changes, which sectors and market segments could react?”
That is a much more practical way to consume macroeconomic information.
Currency Movements Can Create Different Winners and Losers
Consider two businesses. One earns a significant portion of its revenue overseas.
Another imports an important raw material and pays for it in dollars. A weaker rupee does not affect both businesses in the same way.
Currency weakness can support exporters in rupee terms while increasing costs for businesses that depend heavily on imports.
That means a trader analysing an IT company, an oil-dependent business and a domestic bank cannot treat the same currency movement identically.
This is where sector context becomes important.
Layer 2: Find Where the Strength Is
Once the macro picture is understood, the next step is not to immediately pick a stock.
It is to select a sector.
This can be organised through the EIC framework:
Economy → Industry → Company
• Study the economy.
• Identify industries with favourable conditions.
• Then narrow the search to companies within those industries.
This is where NeoTrader can make the transition from macro thinking to actual market analysis much faster.
Layer 3: Translate the Market View Into Action
Suppose your broader research suggests that infrastructure remains an interesting long-term theme.
That still leaves a major problem:
There can be dozens of listed companies connected to infrastructure.
Which ones are actually displaying technical strength now?
This is where a structured NeoTrader workflow can help narrow the market.
Step 1: Start With the NeoTrader Dashboard
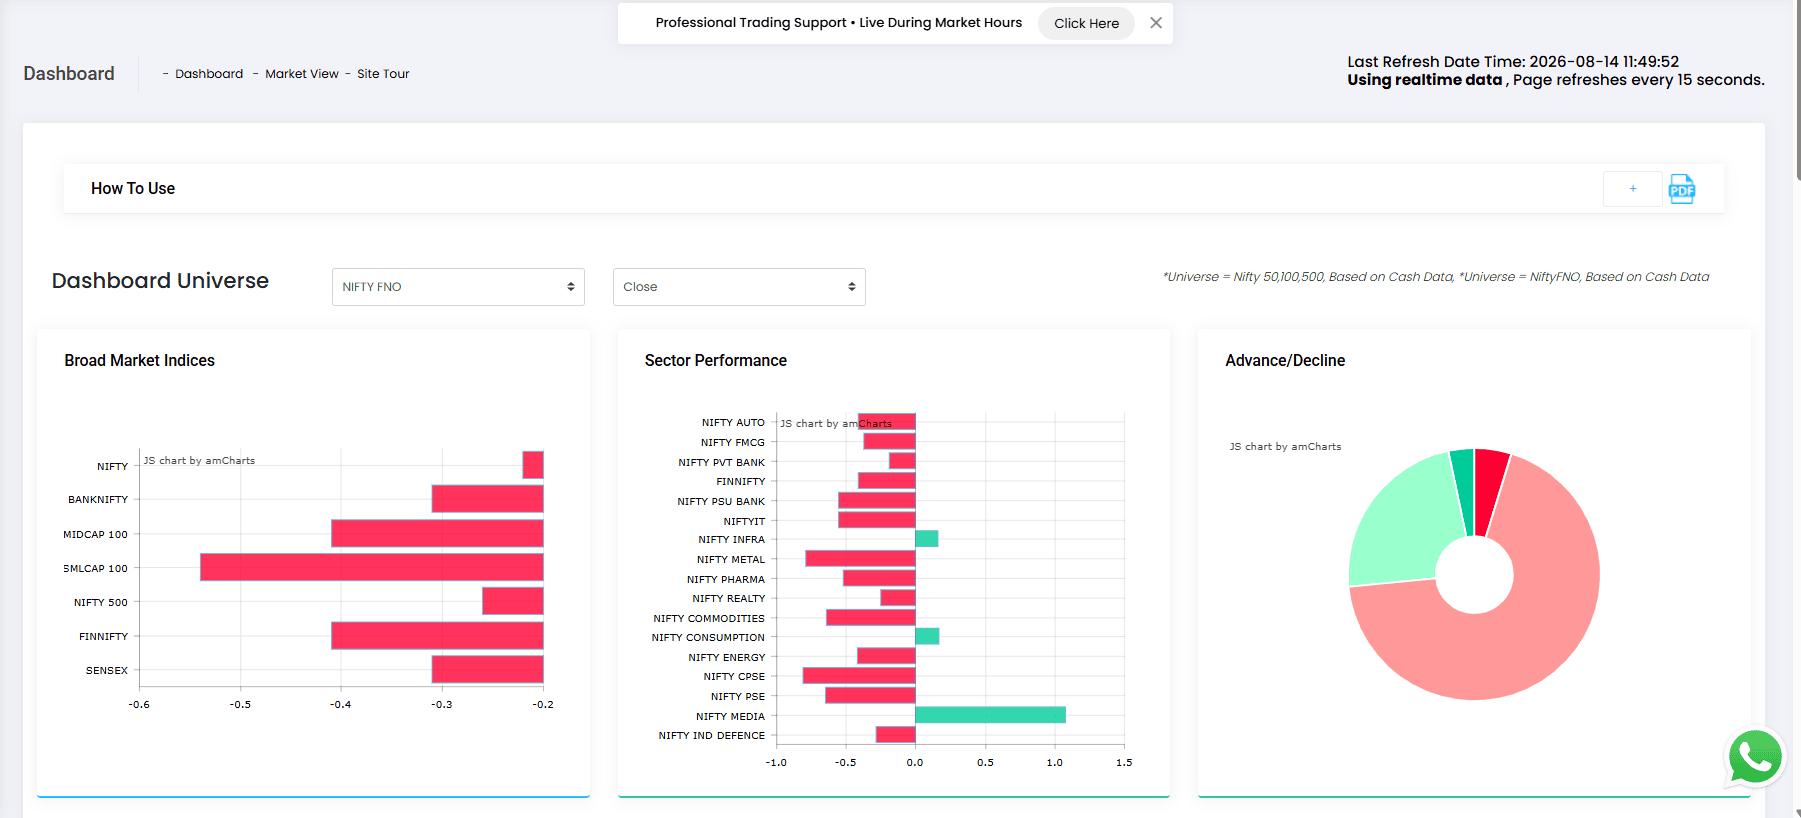
NeoTrader’s Dashboard provides an overview of:
• Broad-market indices
• Sector performance
• Advance-decline breadth
• Bullish and bearish participation
• Market heat-map information
This provides a quick view of whether the current market is broadly supporting or opposing your thesis.
This matters.
A strong fundamental narrative and weak current price action can coexist.
An Alpha Trader should be able to recognise both.
Step 2: Filter the Sector
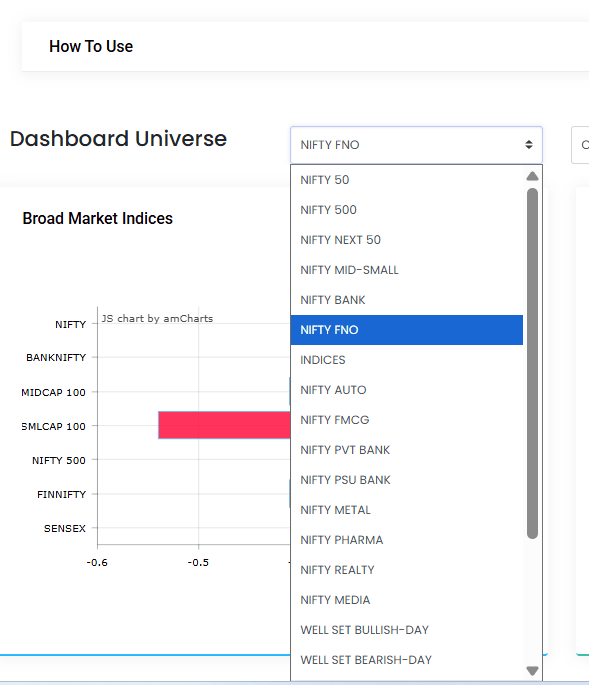
NeoTrader’s Query Window allows users to filter stocks by sectors such as Pharma, Auto and other categories instead of analysing the entire market universe together.
Now the process changes from:
“Which stock should I trade?”
To:
“Within the sector I already want to study, which stocks are technically interesting?”
That is a far more focused question.
Step 3: Look for Confirmation, Not Just Activity
A stock appearing once in a technical scan does not necessarily make it compelling.
NeoTrader’s Expert Alerts contains multiple technical modules.
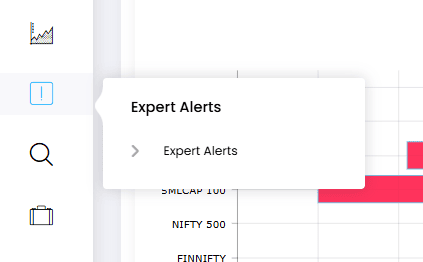
The Summary function can highlight stocks appearing across more than one technical study. Users looking for another layer of confirmation can then add shortlisted stocks to a Dynamic Watch list and monitor additional signals through Rolling Ticker.
For a serious trader, this is where the platform becomes more than a scanner.
The workflow becomes:
Fundamental Thesis → Sector Thesis → Technical Shortlist → Multiple Confirmations → Execution Decision
Why Commodity Analysis Belongs in Your Equity Process
Another area advanced traders often underestimate is commodities.
Suppose copper prices rise significantly.
For a company where copper is an important input cost, margins could face pressure if that increase cannot be passed on to customers.
Conversely, a commodity producer may benefit from stronger pricing.
Changes in raw-material prices can flow directly into corporate profitability, depending on how much of the cost a company can absorb or pass on.
This relationship can broadly be represented as:
Commodity → Company Costs → Margins → Earnings Expectations → Stock Price
Technical analysis can then indicate whether the market has begun to recognise that change.
Fundamentals Tell You Where to Look. Technicals Tell You What the Market Is Doing.
This is one of the most useful distinctions to understand.
Fundamental research can help identify:
What deserves attention.
Technical analysis can help identify:
What the market is doing with that information.
Neither needs to replace the other.
NeoTrader’s role sits primarily in that second stage.
For example, once you have identified a sector thesis, you can use:
• Market View
• Sector Performance
• Active Stocks
• Well-Set Bull/Bear
• Taking Guard
• Expert Alerts
• Rolling Ticker
• Dynamic Watchlists
• Stock Analyzer
These tools can help you progressively narrow the market rather than manually reviewing hundreds of charts.
The platform supports a market-to-sector-to-stock approach before you move towards individual trading opportunities.
The Alpha Trader Framework
A practical routine could therefore look like this:
1. Understand the Macro Story
Study interest rates, currency movements, commodities, policy and liquidity.
2. Build Your Sector Thesis
Identify which industries could potentially benefit from the broader environment.
3. Compare the Thesis With the Current Market
Check whether the sector is actually participating in the current market movement.
4. Filter the Stocks
Use NeoTrader to reduce the larger stock universe to a focused shortlist.
5. Look for Multiple Technical Confirmations
Do not rely on one isolated signal.
6. Study the Individual Stock
Understand its trend, momentum, important levels and risk.
7. Decide Whether the Opportunity Fits Your Trading Plan
NeoTrader supports the analysis process; the final decision remains with the user.
Conclusion
The difference between analysing markets and merely analysing charts is context.
A chart tells you what price is doing.
Intermarket analysis can help explain the environment surrounding that movement.
Sector analysis narrows the opportunity.
Technical tools help identify whether price action supports the larger thesis.
A structured approach can therefore be summarised as:
Macro → Sector → Stock → Technical Confirmation → Decision
For serious traders, the objective is not to collect more indicators.
It is to connect information better.
NeoTrader helps bring the technical side of that process into one structured workflow—so the research you conduct outside the chart can be translated into what is actually happening in the market today.
See the Market-to-Stock Workflow in Action
Want to see how the Market → Sector → Stock workflow works inside NeoTrader?
Explore NeoTrader or book a live platform walkthrough with our team.
(Disclaimer: For educational and informational purposes only. Trading and investing involve market risk. References to sectors or companies are illustrative examples and are not recommendations to buy or sell securities.)
Like what you see? Share with a friend.


