








TCS Q2 FY27: Can AI Refuel Growth as IT Giant Shows Reversal?
India’s IT sector is at an inflection point. Artificial intelligence is opening new revenue streams while forcing traditional service providers to rethink pricing, delivery and profitability. Tata Consultancy Services’ (TCS) Q2 FY27 results capture both sides of that transition.
Earnings: Resilient Growth, Rising Costs
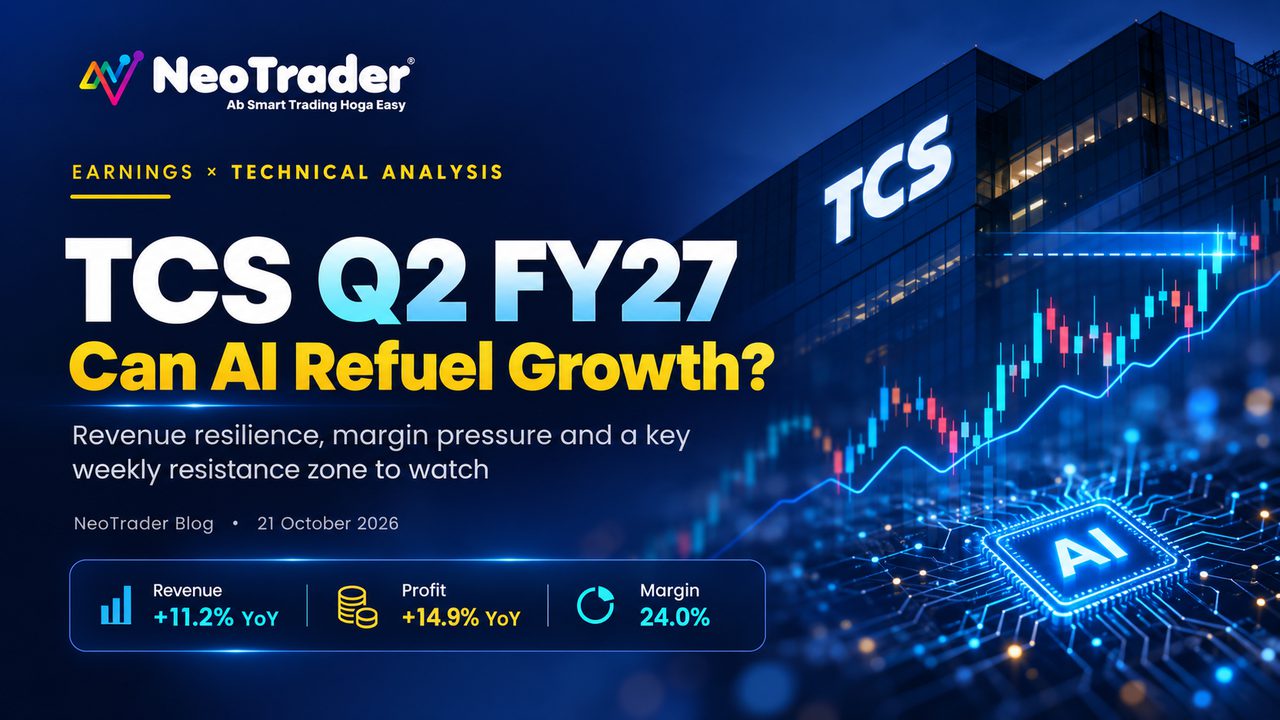
TCS reported revenue of ₹73,188 crore, up 11.2% year-on-year from ₹65,799 crore. Consolidated profit for the period rose 14.9% to ₹13,934 crore from ₹12,131 crore; profit attributable to shareholders was ₹13,884 crore. Yet total expenses climbed nearly 13%, outpacing revenue growth. Operating margin stood at 24%, highlighting the pressure to turn growth into stronger profitability.
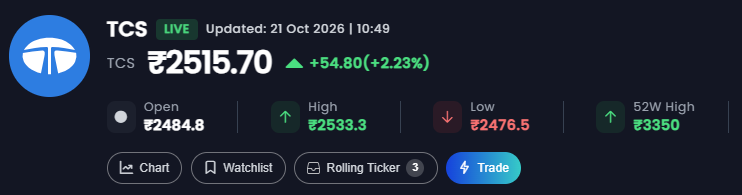
TCS live market snapshot on NeoTrader (21 October 2026)
AI at the Centre of the Story
AI is increasingly central to that effort. TCS reported annualised AI revenue of $3.1 billion, while deal wins and cloud-modernisation demand suggest opportunities ahead. However, clients remain cautious about discretionary spending, and AI-led automation could challenge legacy billing models.
Price Action: A Potential Double-Bottom Reversal
The stock’s post-results recovery is becoming equally interesting. Its weekly chart displays a potential classic double-bottom reversal pattern after an extended decline.
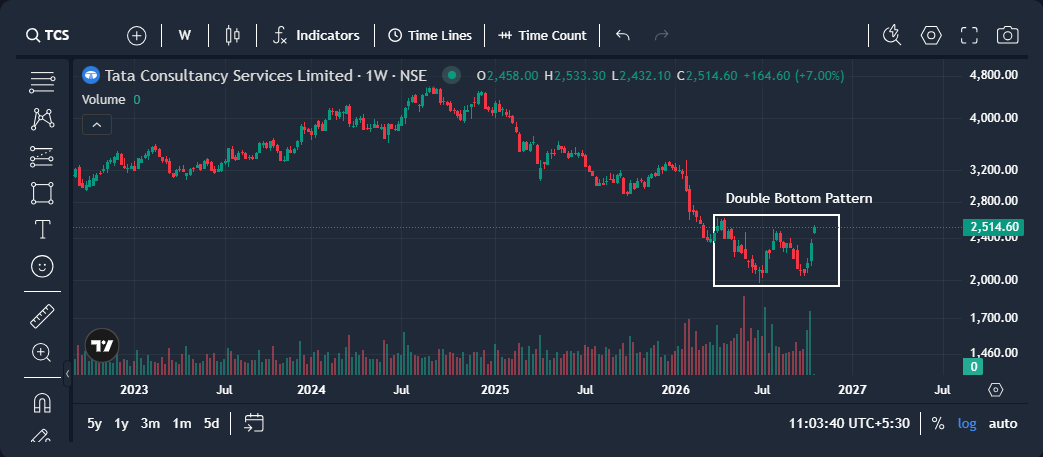
TCS weekly chart showing a potential double-bottom reversal pattern
TCS | Weekly Technical Evidence
NeoTrader’s weekly Signal Strength dashboard identifies TCS as “Well Set Bull”, while its trend snapshot indicates “Strong Bullish”.
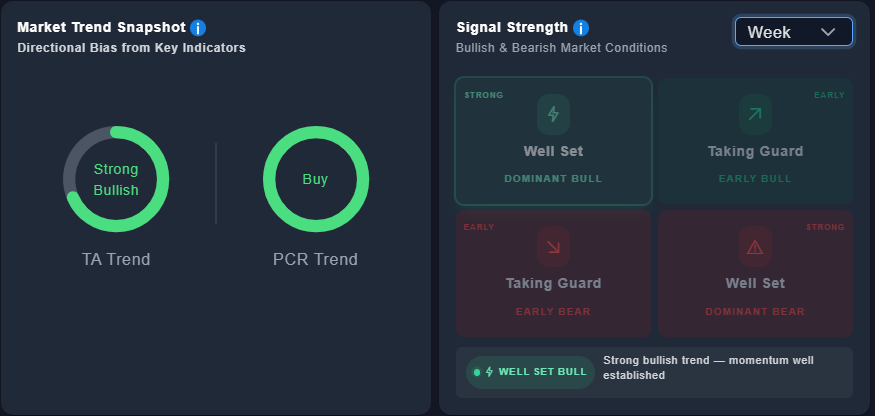
NeoTrader market trend snapshot and weekly Well Set Bull signal
Around ₹2,515 on 21 October 2026, the stock was above the weekly Camarilla R4 level near ₹2,496. The ₹2,550–₹2,552 zone is a near-term resistance test. Sustained strength above that zone would support the case for the recovery rally to continue; rejection could lead to consolidation.
NeoTrader confirms improving weekly momentum, with the following Camarilla levels worth monitoring on the weekly timeframe:
- Resistance level: 2,817.75
- Support level: 2,276.91

Weekly Camarilla, Fibonacci and CPR pivot levels on NeoTrader
Conclusion | Key Takeaways
- Earnings: Revenue and profit grew, but rising costs remain a concern.
- Price action: The post-results rebound is shaping a potential weekly double-bottom reversal.
- NeoTrader signals: Weekly Well Set Bull and Strong Bullish readings indicate improving momentum.
- Rally outlook: A sustained break above ₹2,550–₹2,552 could extend the recovery; rejection may prompt consolidation.
Track Market-Moving Stocks with NeoTrader
Want to see how NeoTrader’s signals, trend analysis and dashboard read a stock like TCS after a big result?
Book a guided platform walkthrough with our team.
(Disclaimer: For educational and informational purposes only. This is not investment advice or a recommendation to buy or sell any security. Trading and investing involve market risk. Company results, technical signals and outlooks do not guarantee future performance. Please do your own research or consult a registered advisor.)
Like what you see? Share with a friend.


